Ottawa vs Fijian College, Under 1 year
COMPARE
Ottawa
Fijian
College, Under 1 year
College, Under 1 year Comparison
Ottawa
Fijians
62.2%
COLLEGE, UNDER 1 YEAR
1.1/ 100
METRIC RATING
241st/ 347
METRIC RANK
57.7%
COLLEGE, UNDER 1 YEAR
0.0/ 100
METRIC RATING
307th/ 347
METRIC RANK
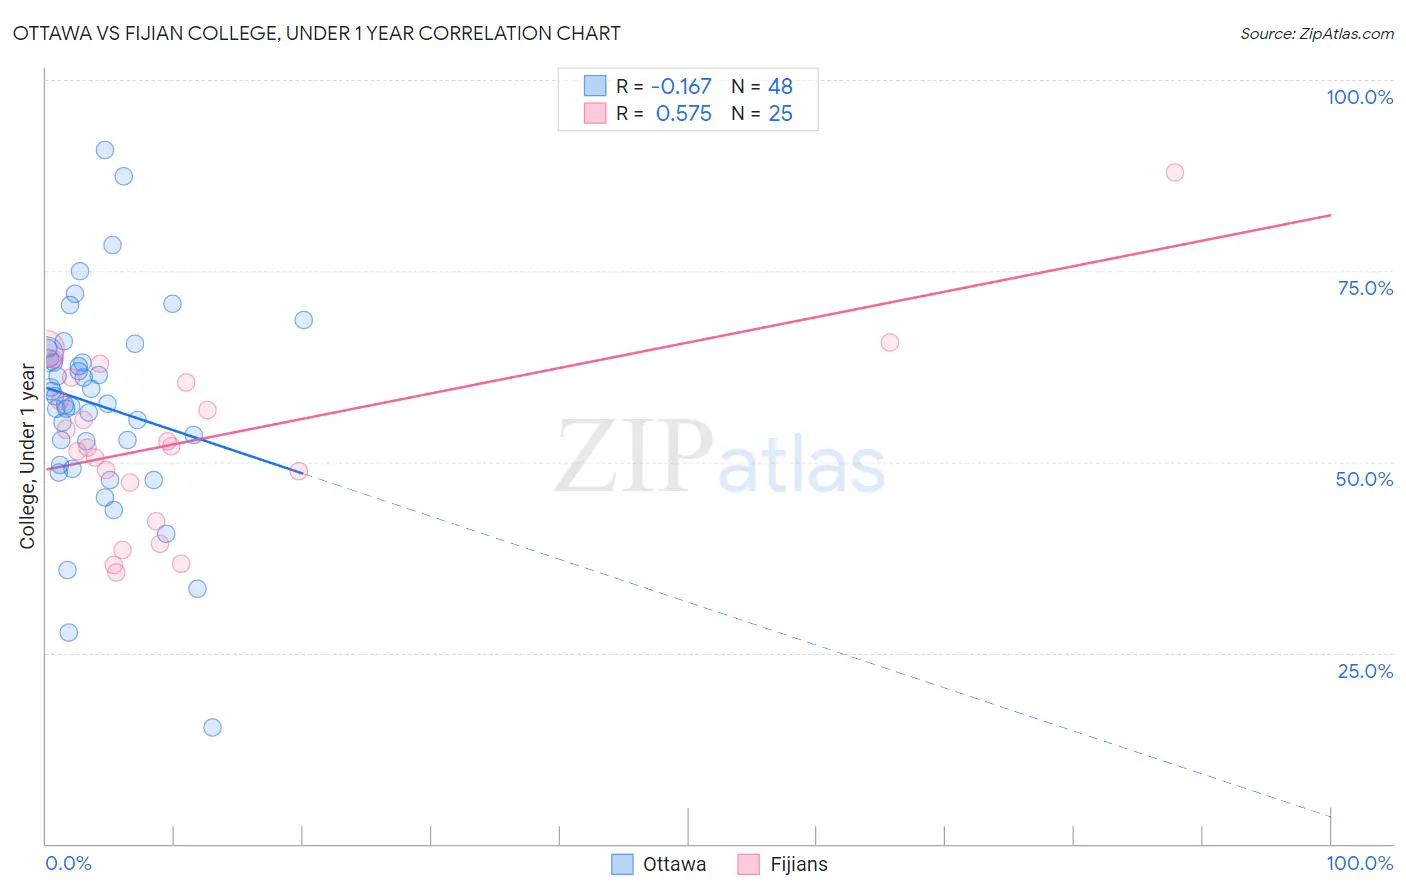
Ottawa vs Fijian College, Under 1 year Correlation Chart
The statistical analysis conducted on geographies consisting of 49,956,726 people shows a poor negative correlation between the proportion of Ottawa and percentage of population with at least college, under 1 year education in the United States with a correlation coefficient (R) of -0.167 and weighted average of 62.2%. Similarly, the statistical analysis conducted on geographies consisting of 55,948,842 people shows a substantial positive correlation between the proportion of Fijians and percentage of population with at least college, under 1 year education in the United States with a correlation coefficient (R) of 0.575 and weighted average of 57.7%, a difference of 7.9%.
College, Under 1 year Correlation Summary
| Measurement | Ottawa | Fijian |
| Minimum | 15.3% | 35.5% |
| Maximum | 90.8% | 87.8% |
| Range | 75.6% | 52.4% |
| Mean | 57.5% | 52.9% |
| Median | 58.1% | 52.0% |
| Interquartile 25% (IQ1) | 51.2% | 44.7% |
| Interquartile 75% (IQ3) | 63.8% | 60.7% |
| Interquartile Range (IQR) | 12.6% | 16.0% |
| Standard Deviation (Sample) | 13.6% | 11.8% |
| Standard Deviation (Population) | 13.5% | 11.5% |
Similar Demographics by College, Under 1 year
Demographics Similar to Ottawa by College, Under 1 year
In terms of college, under 1 year, the demographic groups most similar to Ottawa are Nepalese (62.2%, a difference of 0.010%), Aleut (62.2%, a difference of 0.010%), Malaysian (62.2%, a difference of 0.050%), Hawaiian (62.1%, a difference of 0.080%), and Colville (62.1%, a difference of 0.17%).
| Demographics | Rating | Rank | College, Under 1 year |
| Chippewa | 2.0 /100 | #234 | Tragic 62.6% |
| Spanish Americans | 1.9 /100 | #235 | Tragic 62.6% |
| Immigrants | Immigrants | 1.7 /100 | #236 | Tragic 62.5% |
| Immigrants | Burma/Myanmar | 1.6 /100 | #237 | Tragic 62.5% |
| French American Indians | 1.5 /100 | #238 | Tragic 62.4% |
| Nepalese | 1.1 /100 | #239 | Tragic 62.2% |
| Aleuts | 1.1 /100 | #240 | Tragic 62.2% |
| Ottawa | 1.1 /100 | #241 | Tragic 62.2% |
| Malaysians | 1.1 /100 | #242 | Tragic 62.2% |
| Hawaiians | 1.1 /100 | #243 | Tragic 62.1% |
| Colville | 1.0 /100 | #244 | Tragic 62.1% |
| Delaware | 0.9 /100 | #245 | Tragic 62.1% |
| Marshallese | 0.8 /100 | #246 | Tragic 61.9% |
| Immigrants | Liberia | 0.8 /100 | #247 | Tragic 61.9% |
| Potawatomi | 0.6 /100 | #248 | Tragic 61.8% |
Demographics Similar to Fijians by College, Under 1 year
In terms of college, under 1 year, the demographic groups most similar to Fijians are Central American (57.7%, a difference of 0.0%), Immigrants from Portugal (57.7%, a difference of 0.010%), Immigrants from Nicaragua (57.6%, a difference of 0.12%), Haitian (57.8%, a difference of 0.21%), and Kiowa (57.8%, a difference of 0.32%).
| Demographics | Rating | Rank | College, Under 1 year |
| Immigrants | Guyana | 0.0 /100 | #300 | Tragic 58.5% |
| Mexican American Indians | 0.0 /100 | #301 | Tragic 58.1% |
| Apache | 0.0 /100 | #302 | Tragic 58.0% |
| Immigrants | Dominica | 0.0 /100 | #303 | Tragic 57.9% |
| Kiowa | 0.0 /100 | #304 | Tragic 57.8% |
| Haitians | 0.0 /100 | #305 | Tragic 57.8% |
| Immigrants | Portugal | 0.0 /100 | #306 | Tragic 57.7% |
| Fijians | 0.0 /100 | #307 | Tragic 57.7% |
| Central Americans | 0.0 /100 | #308 | Tragic 57.7% |
| Immigrants | Nicaragua | 0.0 /100 | #309 | Tragic 57.6% |
| Pueblo | 0.0 /100 | #310 | Tragic 57.4% |
| Cajuns | 0.0 /100 | #311 | Tragic 57.3% |
| Salvadorans | 0.0 /100 | #312 | Tragic 57.3% |
| Dutch West Indians | 0.0 /100 | #313 | Tragic 57.2% |
| Hopi | 0.0 /100 | #314 | Tragic 57.1% |