Ottawa vs Immigrants from Canada College, Under 1 year
COMPARE
Ottawa
Immigrants from Canada
College, Under 1 year
College, Under 1 year Comparison
Ottawa
Immigrants from Canada
62.2%
COLLEGE, UNDER 1 YEAR
1.1/ 100
METRIC RATING
241st/ 347
METRIC RANK
69.1%
COLLEGE, UNDER 1 YEAR
99.4/ 100
METRIC RATING
63rd/ 347
METRIC RANK
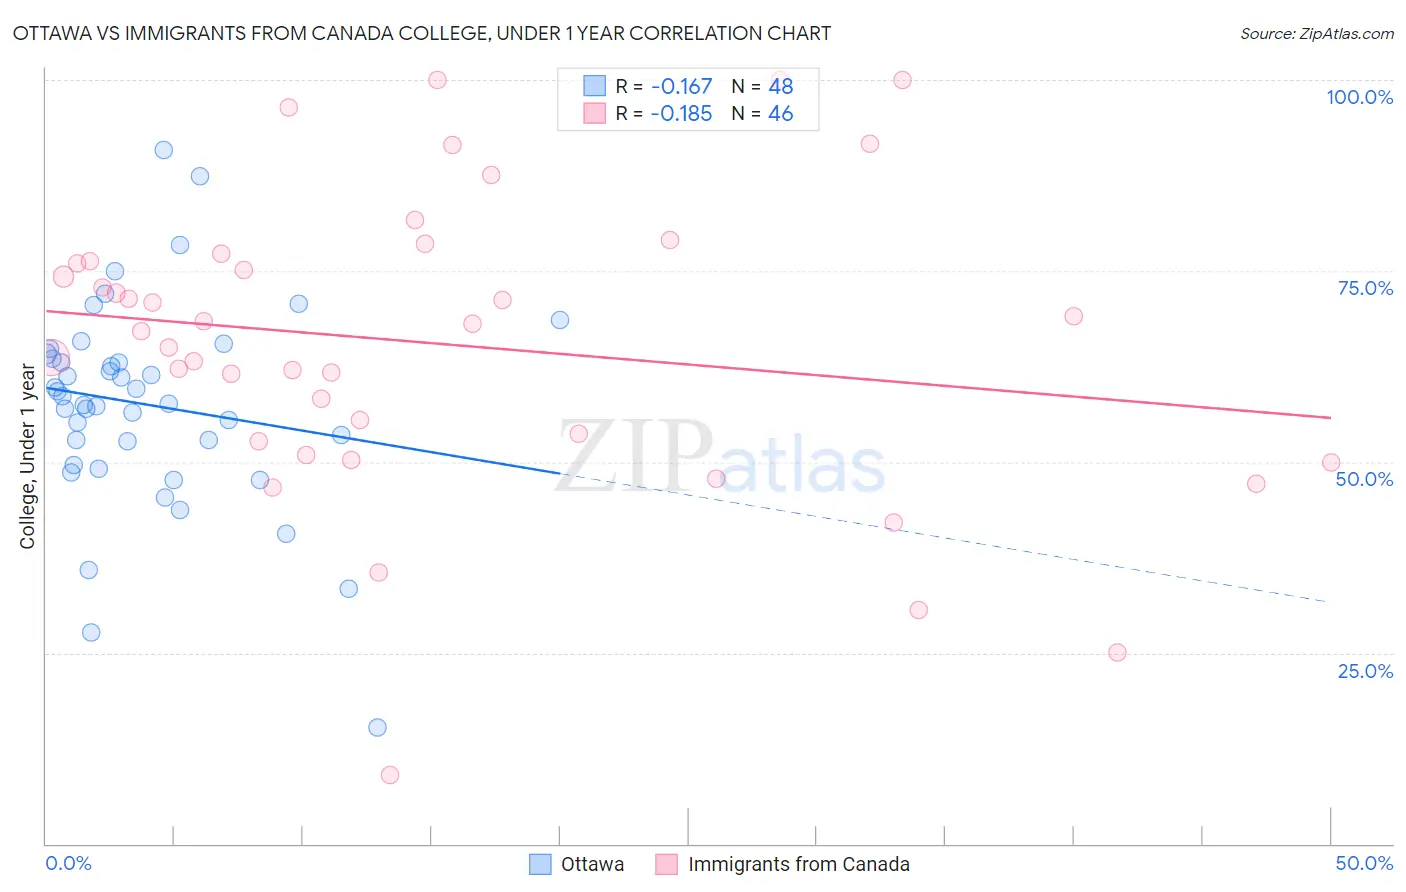
Ottawa vs Immigrants from Canada College, Under 1 year Correlation Chart
The statistical analysis conducted on geographies consisting of 49,956,726 people shows a poor negative correlation between the proportion of Ottawa and percentage of population with at least college, under 1 year education in the United States with a correlation coefficient (R) of -0.167 and weighted average of 62.2%. Similarly, the statistical analysis conducted on geographies consisting of 459,392,552 people shows a poor negative correlation between the proportion of Immigrants from Canada and percentage of population with at least college, under 1 year education in the United States with a correlation coefficient (R) of -0.185 and weighted average of 69.1%, a difference of 11.1%.
College, Under 1 year Correlation Summary
| Measurement | Ottawa | Immigrants from Canada |
| Minimum | 15.3% | 9.0% |
| Maximum | 90.8% | 100.0% |
| Range | 75.6% | 91.0% |
| Mean | 57.5% | 65.5% |
| Median | 58.1% | 67.6% |
| Interquartile 25% (IQ1) | 51.2% | 52.7% |
| Interquartile 75% (IQ3) | 63.8% | 76.3% |
| Interquartile Range (IQR) | 12.6% | 23.5% |
| Standard Deviation (Sample) | 13.6% | 19.7% |
| Standard Deviation (Population) | 13.5% | 19.5% |
Similar Demographics by College, Under 1 year
Demographics Similar to Ottawa by College, Under 1 year
In terms of college, under 1 year, the demographic groups most similar to Ottawa are Nepalese (62.2%, a difference of 0.010%), Aleut (62.2%, a difference of 0.010%), Malaysian (62.2%, a difference of 0.050%), Hawaiian (62.1%, a difference of 0.080%), and Colville (62.1%, a difference of 0.17%).
| Demographics | Rating | Rank | College, Under 1 year |
| Chippewa | 2.0 /100 | #234 | Tragic 62.6% |
| Spanish Americans | 1.9 /100 | #235 | Tragic 62.6% |
| Immigrants | Immigrants | 1.7 /100 | #236 | Tragic 62.5% |
| Immigrants | Burma/Myanmar | 1.6 /100 | #237 | Tragic 62.5% |
| French American Indians | 1.5 /100 | #238 | Tragic 62.4% |
| Nepalese | 1.1 /100 | #239 | Tragic 62.2% |
| Aleuts | 1.1 /100 | #240 | Tragic 62.2% |
| Ottawa | 1.1 /100 | #241 | Tragic 62.2% |
| Malaysians | 1.1 /100 | #242 | Tragic 62.2% |
| Hawaiians | 1.1 /100 | #243 | Tragic 62.1% |
| Colville | 1.0 /100 | #244 | Tragic 62.1% |
| Delaware | 0.9 /100 | #245 | Tragic 62.1% |
| Marshallese | 0.8 /100 | #246 | Tragic 61.9% |
| Immigrants | Liberia | 0.8 /100 | #247 | Tragic 61.9% |
| Potawatomi | 0.6 /100 | #248 | Tragic 61.8% |
Demographics Similar to Immigrants from Canada by College, Under 1 year
In terms of college, under 1 year, the demographic groups most similar to Immigrants from Canada are Northern European (69.0%, a difference of 0.040%), Immigrants from Moldova (69.0%, a difference of 0.060%), Immigrants from North America (69.0%, a difference of 0.080%), Immigrants from Kazakhstan (69.2%, a difference of 0.13%), and Immigrants from Belarus (69.2%, a difference of 0.13%).
| Demographics | Rating | Rank | College, Under 1 year |
| Immigrants | Scotland | 99.6 /100 | #56 | Exceptional 69.4% |
| Asians | 99.6 /100 | #57 | Exceptional 69.4% |
| Immigrants | Malaysia | 99.6 /100 | #58 | Exceptional 69.3% |
| Immigrants | Serbia | 99.5 /100 | #59 | Exceptional 69.3% |
| Immigrants | Asia | 99.5 /100 | #60 | Exceptional 69.2% |
| Immigrants | Kazakhstan | 99.5 /100 | #61 | Exceptional 69.2% |
| Immigrants | Belarus | 99.5 /100 | #62 | Exceptional 69.2% |
| Immigrants | Canada | 99.4 /100 | #63 | Exceptional 69.1% |
| Northern Europeans | 99.4 /100 | #64 | Exceptional 69.0% |
| Immigrants | Moldova | 99.3 /100 | #65 | Exceptional 69.0% |
| Immigrants | North America | 99.3 /100 | #66 | Exceptional 69.0% |
| Immigrants | Zimbabwe | 99.2 /100 | #67 | Exceptional 68.9% |
| Immigrants | Indonesia | 99.2 /100 | #68 | Exceptional 68.9% |
| Immigrants | Romania | 99.2 /100 | #69 | Exceptional 68.9% |
| Lithuanians | 99.1 /100 | #70 | Exceptional 68.8% |