Ottawa vs Immigrants from Australia College, Under 1 year
COMPARE
Ottawa
Immigrants from Australia
College, Under 1 year
College, Under 1 year Comparison
Ottawa
Immigrants from Australia
62.2%
COLLEGE, UNDER 1 YEAR
1.1/ 100
METRIC RATING
241st/ 347
METRIC RANK
72.7%
COLLEGE, UNDER 1 YEAR
100.0/ 100
METRIC RATING
9th/ 347
METRIC RANK
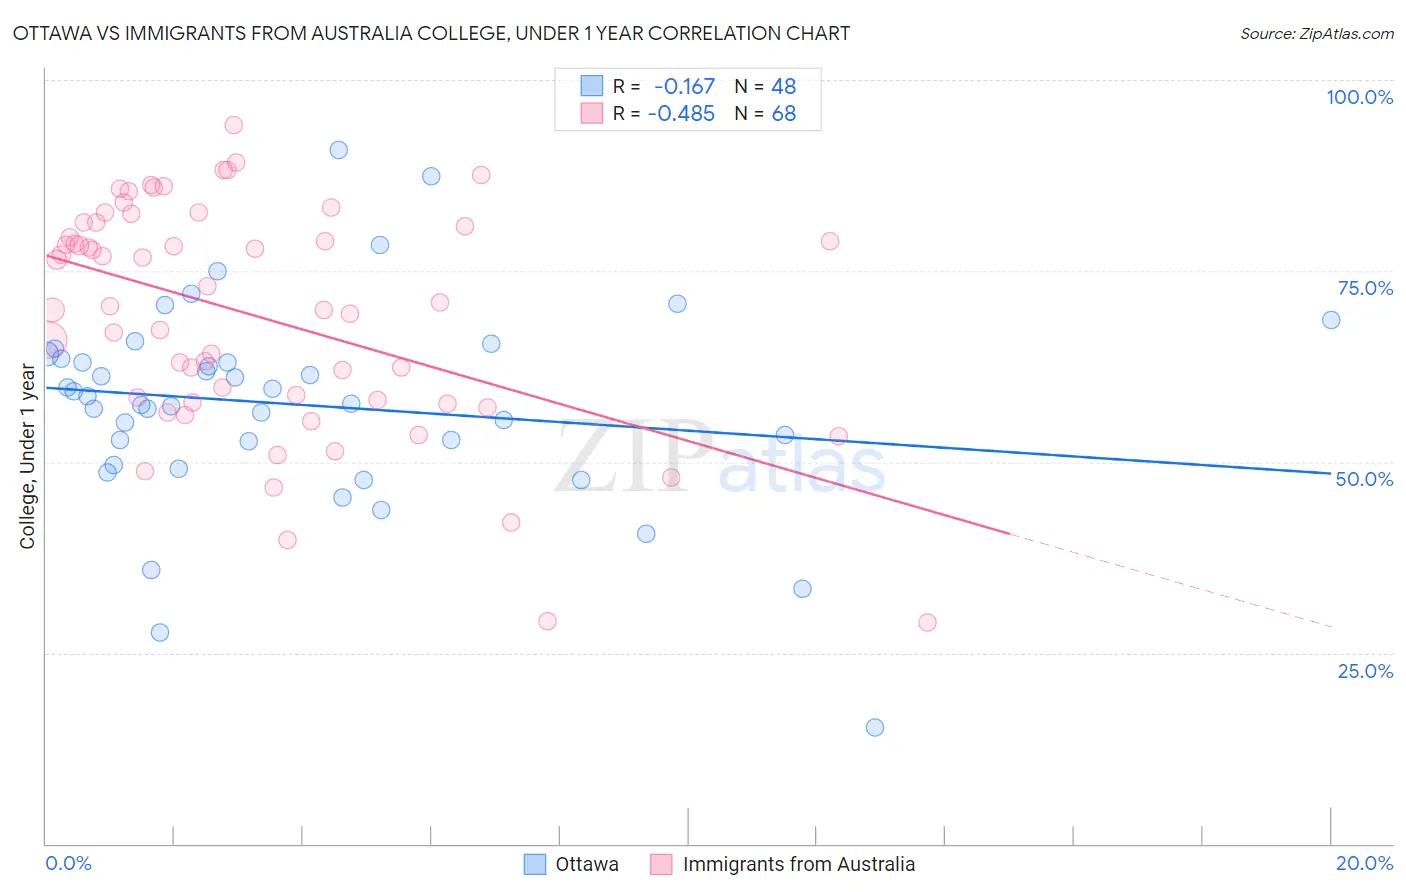
Ottawa vs Immigrants from Australia College, Under 1 year Correlation Chart
The statistical analysis conducted on geographies consisting of 49,956,726 people shows a poor negative correlation between the proportion of Ottawa and percentage of population with at least college, under 1 year education in the United States with a correlation coefficient (R) of -0.167 and weighted average of 62.2%. Similarly, the statistical analysis conducted on geographies consisting of 227,203,336 people shows a moderate negative correlation between the proportion of Immigrants from Australia and percentage of population with at least college, under 1 year education in the United States with a correlation coefficient (R) of -0.485 and weighted average of 72.7%, a difference of 17.0%.
College, Under 1 year Correlation Summary
| Measurement | Ottawa | Immigrants from Australia |
| Minimum | 15.3% | 28.9% |
| Maximum | 90.8% | 94.1% |
| Range | 75.6% | 65.1% |
| Mean | 57.5% | 69.1% |
| Median | 58.1% | 70.6% |
| Interquartile 25% (IQ1) | 51.2% | 57.9% |
| Interquartile 75% (IQ3) | 63.8% | 81.1% |
| Interquartile Range (IQR) | 12.6% | 23.2% |
| Standard Deviation (Sample) | 13.6% | 14.9% |
| Standard Deviation (Population) | 13.5% | 14.8% |
Similar Demographics by College, Under 1 year
Demographics Similar to Ottawa by College, Under 1 year
In terms of college, under 1 year, the demographic groups most similar to Ottawa are Nepalese (62.2%, a difference of 0.010%), Aleut (62.2%, a difference of 0.010%), Malaysian (62.2%, a difference of 0.050%), Hawaiian (62.1%, a difference of 0.080%), and Colville (62.1%, a difference of 0.17%).
| Demographics | Rating | Rank | College, Under 1 year |
| Chippewa | 2.0 /100 | #234 | Tragic 62.6% |
| Spanish Americans | 1.9 /100 | #235 | Tragic 62.6% |
| Immigrants | Immigrants | 1.7 /100 | #236 | Tragic 62.5% |
| Immigrants | Burma/Myanmar | 1.6 /100 | #237 | Tragic 62.5% |
| French American Indians | 1.5 /100 | #238 | Tragic 62.4% |
| Nepalese | 1.1 /100 | #239 | Tragic 62.2% |
| Aleuts | 1.1 /100 | #240 | Tragic 62.2% |
| Ottawa | 1.1 /100 | #241 | Tragic 62.2% |
| Malaysians | 1.1 /100 | #242 | Tragic 62.2% |
| Hawaiians | 1.1 /100 | #243 | Tragic 62.1% |
| Colville | 1.0 /100 | #244 | Tragic 62.1% |
| Delaware | 0.9 /100 | #245 | Tragic 62.1% |
| Marshallese | 0.8 /100 | #246 | Tragic 61.9% |
| Immigrants | Liberia | 0.8 /100 | #247 | Tragic 61.9% |
| Potawatomi | 0.6 /100 | #248 | Tragic 61.8% |
Demographics Similar to Immigrants from Australia by College, Under 1 year
In terms of college, under 1 year, the demographic groups most similar to Immigrants from Australia are Immigrants from Israel (72.3%, a difference of 0.62%), Immigrants from South Central Asia (72.1%, a difference of 0.92%), Immigrants from Sweden (72.1%, a difference of 0.93%), Thai (73.4%, a difference of 0.95%), and Cypriot (72.0%, a difference of 1.1%).
| Demographics | Rating | Rank | College, Under 1 year |
| Iranians | 100.0 /100 | #2 | Exceptional 74.9% |
| Immigrants | Singapore | 100.0 /100 | #3 | Exceptional 74.8% |
| Immigrants | India | 100.0 /100 | #4 | Exceptional 74.4% |
| Immigrants | Iran | 100.0 /100 | #5 | Exceptional 74.3% |
| Immigrants | Taiwan | 100.0 /100 | #6 | Exceptional 74.2% |
| Okinawans | 100.0 /100 | #7 | Exceptional 73.7% |
| Thais | 100.0 /100 | #8 | Exceptional 73.4% |
| Immigrants | Australia | 100.0 /100 | #9 | Exceptional 72.7% |
| Immigrants | Israel | 100.0 /100 | #10 | Exceptional 72.3% |
| Immigrants | South Central Asia | 100.0 /100 | #11 | Exceptional 72.1% |
| Immigrants | Sweden | 100.0 /100 | #12 | Exceptional 72.1% |
| Cypriots | 100.0 /100 | #13 | Exceptional 72.0% |
| Cambodians | 100.0 /100 | #14 | Exceptional 71.9% |
| Burmese | 100.0 /100 | #15 | Exceptional 71.9% |
| Immigrants | Japan | 100.0 /100 | #16 | Exceptional 71.9% |