Ottawa vs Fijian No Schooling Completed
COMPARE
Ottawa
Fijian
No Schooling Completed
No Schooling Completed Comparison
Ottawa
Fijians
1.6%
NO SCHOOLING COMPLETED
99.9/ 100
METRIC RATING
47th/ 347
METRIC RANK
2.5%
NO SCHOOLING COMPLETED
0.4/ 100
METRIC RATING
266th/ 347
METRIC RANK
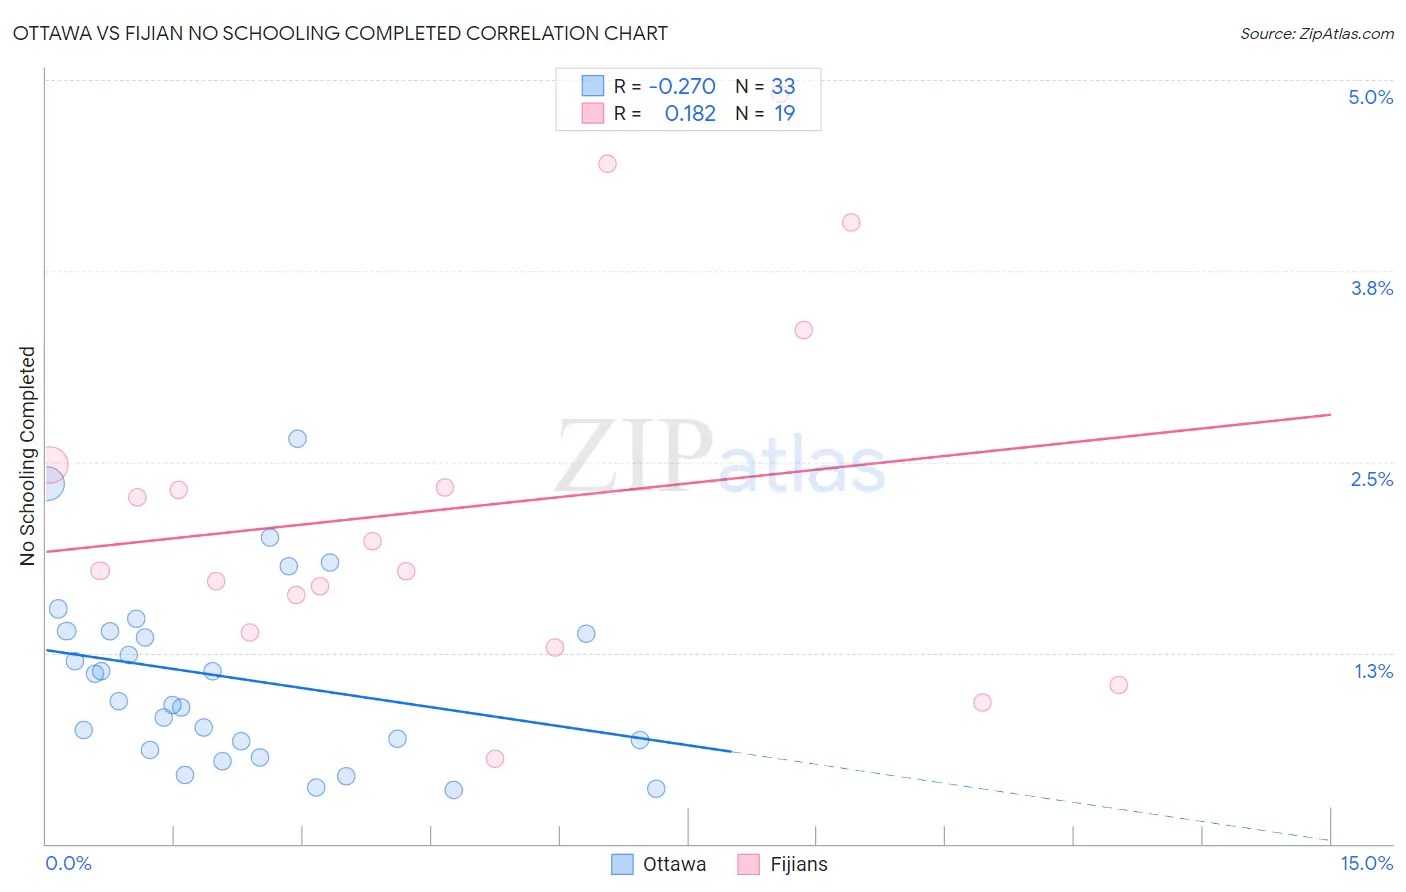
Ottawa vs Fijian No Schooling Completed Correlation Chart
The statistical analysis conducted on geographies consisting of 49,739,017 people shows a weak negative correlation between the proportion of Ottawa and percentage of population with no schooling in the United States with a correlation coefficient (R) of -0.270 and weighted average of 1.6%. Similarly, the statistical analysis conducted on geographies consisting of 55,808,441 people shows a poor positive correlation between the proportion of Fijians and percentage of population with no schooling in the United States with a correlation coefficient (R) of 0.182 and weighted average of 2.5%, a difference of 52.6%.
No Schooling Completed Correlation Summary
| Measurement | Ottawa | Fijian |
| Minimum | 0.35% | 0.56% |
| Maximum | 2.6% | 4.9% |
| Range | 2.3% | 4.4% |
| Mean | 1.1% | 2.2% |
| Median | 0.93% | 1.8% |
| Interquartile 25% (IQ1) | 0.64% | 1.4% |
| Interquartile 75% (IQ3) | 1.4% | 2.5% |
| Interquartile Range (IQR) | 0.75% | 1.1% |
| Standard Deviation (Sample) | 0.58% | 1.2% |
| Standard Deviation (Population) | 0.57% | 1.2% |
Similar Demographics by No Schooling Completed
Demographics Similar to Ottawa by No Schooling Completed
In terms of no schooling completed, the demographic groups most similar to Ottawa are Maltese (1.6%, a difference of 0.14%), Czechoslovakian (1.6%, a difference of 0.24%), Immigrants from Scotland (1.6%, a difference of 0.26%), Estonian (1.6%, a difference of 0.27%), and White/Caucasian (1.6%, a difference of 0.31%).
| Demographics | Rating | Rank | No Schooling Completed |
| Luxembourgers | 99.9 /100 | #40 | Exceptional 1.6% |
| Hungarians | 99.9 /100 | #41 | Exceptional 1.6% |
| Bulgarians | 99.9 /100 | #42 | Exceptional 1.6% |
| Australians | 99.9 /100 | #43 | Exceptional 1.6% |
| Estonians | 99.9 /100 | #44 | Exceptional 1.6% |
| Czechoslovakians | 99.9 /100 | #45 | Exceptional 1.6% |
| Maltese | 99.9 /100 | #46 | Exceptional 1.6% |
| Ottawa | 99.9 /100 | #47 | Exceptional 1.6% |
| Immigrants | Scotland | 99.9 /100 | #48 | Exceptional 1.6% |
| Whites/Caucasians | 99.9 /100 | #49 | Exceptional 1.6% |
| Celtics | 99.9 /100 | #50 | Exceptional 1.6% |
| Chippewa | 99.8 /100 | #51 | Exceptional 1.6% |
| Immigrants | Canada | 99.8 /100 | #52 | Exceptional 1.6% |
| Creek | 99.8 /100 | #53 | Exceptional 1.6% |
| Crow | 99.8 /100 | #54 | Exceptional 1.6% |
Demographics Similar to Fijians by No Schooling Completed
In terms of no schooling completed, the demographic groups most similar to Fijians are West Indian (2.5%, a difference of 0.080%), Yuman (2.5%, a difference of 0.17%), Indian (Asian) (2.5%, a difference of 0.26%), Immigrants from Liberia (2.5%, a difference of 0.39%), and Taiwanese (2.5%, a difference of 0.44%).
| Demographics | Rating | Rank | No Schooling Completed |
| Immigrants | Jamaica | 0.6 /100 | #259 | Tragic 2.5% |
| Immigrants | Ethiopia | 0.6 /100 | #260 | Tragic 2.5% |
| Armenians | 0.5 /100 | #261 | Tragic 2.5% |
| Immigrants | Sierra Leone | 0.5 /100 | #262 | Tragic 2.5% |
| Immigrants | Liberia | 0.4 /100 | #263 | Tragic 2.5% |
| Indians (Asian) | 0.4 /100 | #264 | Tragic 2.5% |
| West Indians | 0.4 /100 | #265 | Tragic 2.5% |
| Fijians | 0.4 /100 | #266 | Tragic 2.5% |
| Yuman | 0.4 /100 | #267 | Tragic 2.5% |
| Taiwanese | 0.3 /100 | #268 | Tragic 2.5% |
| Immigrants | Nigeria | 0.2 /100 | #269 | Tragic 2.5% |
| Immigrants | Peru | 0.2 /100 | #270 | Tragic 2.5% |
| Cubans | 0.2 /100 | #271 | Tragic 2.5% |
| Immigrants | Bolivia | 0.2 /100 | #272 | Tragic 2.5% |
| Immigrants | Cameroon | 0.1 /100 | #273 | Tragic 2.5% |