Sudanese vs Cambodian Professional Degree
COMPARE
Sudanese
Cambodian
Professional Degree
Professional Degree Comparison
Sudanese
Cambodians
4.6%
PROFESSIONAL DEGREE
81.3/ 100
METRIC RATING
142nd/ 347
METRIC RANK
6.0%
PROFESSIONAL DEGREE
100.0/ 100
METRIC RATING
40th/ 347
METRIC RANK
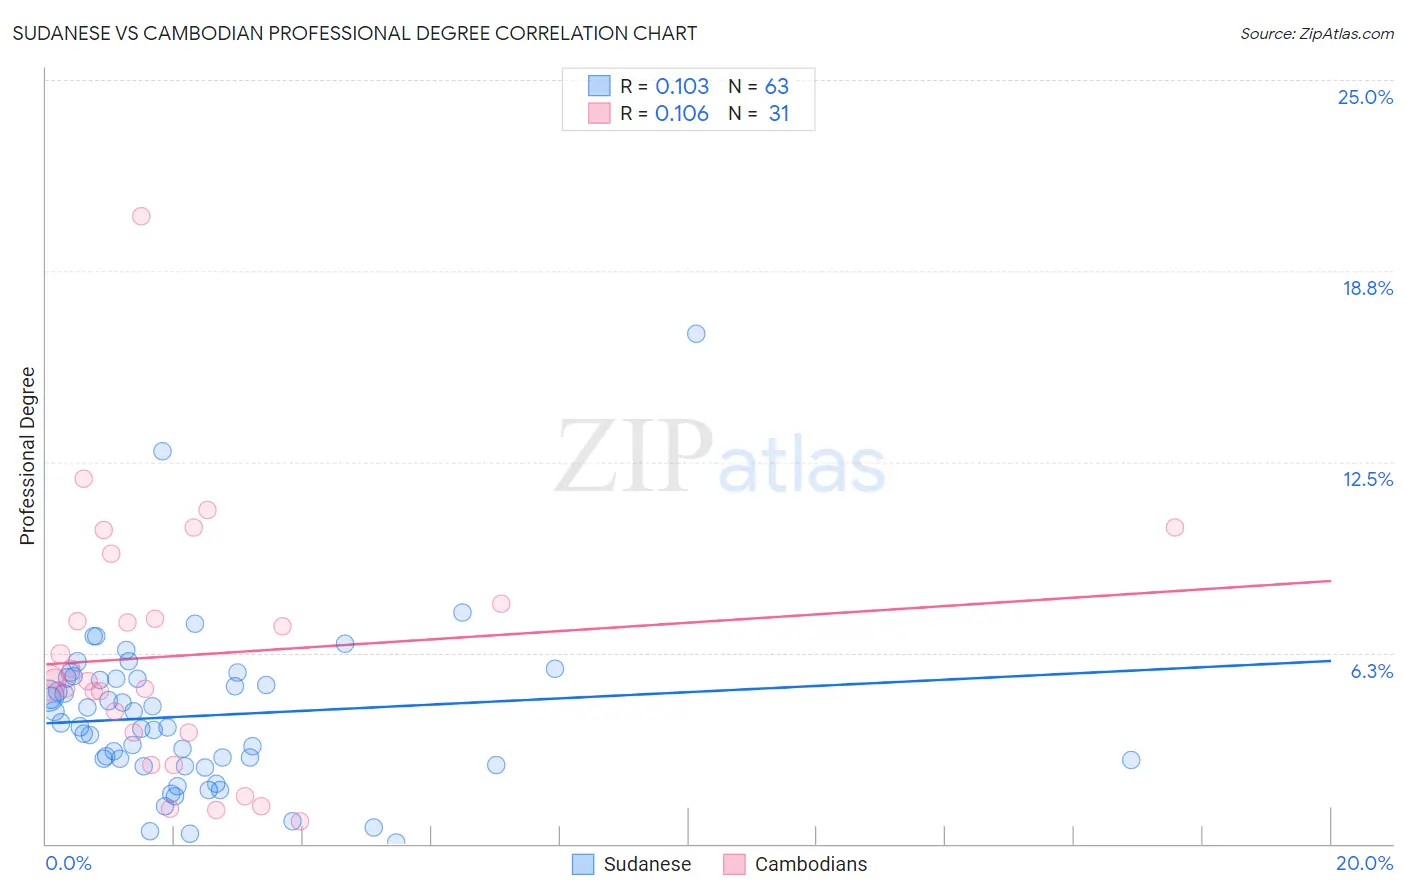
Sudanese vs Cambodian Professional Degree Correlation Chart
The statistical analysis conducted on geographies consisting of 110,066,536 people shows a poor positive correlation between the proportion of Sudanese and percentage of population with at least professional degree education in the United States with a correlation coefficient (R) of 0.103 and weighted average of 4.6%. Similarly, the statistical analysis conducted on geographies consisting of 102,442,026 people shows a poor positive correlation between the proportion of Cambodians and percentage of population with at least professional degree education in the United States with a correlation coefficient (R) of 0.106 and weighted average of 6.0%, a difference of 28.5%.
Professional Degree Correlation Summary
| Measurement | Sudanese | Cambodian |
| Minimum | 0.061% | 0.74% |
| Maximum | 16.7% | 20.5% |
| Range | 16.7% | 19.8% |
| Mean | 4.2% | 6.2% |
| Median | 3.8% | 5.3% |
| Interquartile 25% (IQ1) | 2.6% | 3.6% |
| Interquartile 75% (IQ3) | 5.4% | 7.9% |
| Interquartile Range (IQR) | 2.8% | 4.2% |
| Standard Deviation (Sample) | 2.7% | 4.1% |
| Standard Deviation (Population) | 2.7% | 4.0% |
Similar Demographics by Professional Degree
Demographics Similar to Sudanese by Professional Degree
In terms of professional degree, the demographic groups most similar to Sudanese are Hungarian (4.6%, a difference of 0.11%), Basque (4.6%, a difference of 0.13%), Immigrants from South America (4.6%, a difference of 0.18%), Uruguayan (4.6%, a difference of 0.24%), and Luxembourger (4.6%, a difference of 0.55%).
| Demographics | Rating | Rank | Professional Degree |
| Macedonians | 89.8 /100 | #135 | Excellent 4.8% |
| Immigrants | Jordan | 89.0 /100 | #136 | Excellent 4.7% |
| Jordanians | 88.9 /100 | #137 | Excellent 4.7% |
| Afghans | 88.8 /100 | #138 | Excellent 4.7% |
| South Americans | 85.6 /100 | #139 | Excellent 4.7% |
| Canadians | 84.4 /100 | #140 | Excellent 4.7% |
| Basques | 81.8 /100 | #141 | Excellent 4.6% |
| Sudanese | 81.3 /100 | #142 | Excellent 4.6% |
| Hungarians | 80.8 /100 | #143 | Excellent 4.6% |
| Immigrants | South America | 80.5 /100 | #144 | Excellent 4.6% |
| Uruguayans | 80.2 /100 | #145 | Excellent 4.6% |
| Luxembourgers | 78.7 /100 | #146 | Good 4.6% |
| Colombians | 77.7 /100 | #147 | Good 4.6% |
| Slovenes | 76.1 /100 | #148 | Good 4.6% |
| Senegalese | 75.3 /100 | #149 | Good 4.6% |
Demographics Similar to Cambodians by Professional Degree
In terms of professional degree, the demographic groups most similar to Cambodians are New Zealander (6.0%, a difference of 0.18%), Estonian (6.0%, a difference of 0.19%), Immigrants from South Africa (6.0%, a difference of 0.47%), Immigrants from Saudi Arabia (5.9%, a difference of 0.52%), and Argentinean (5.9%, a difference of 0.68%).
| Demographics | Rating | Rank | Professional Degree |
| Burmese | 100.0 /100 | #33 | Exceptional 6.1% |
| Mongolians | 100.0 /100 | #34 | Exceptional 6.1% |
| Immigrants | Korea | 100.0 /100 | #35 | Exceptional 6.1% |
| Immigrants | Russia | 100.0 /100 | #36 | Exceptional 6.0% |
| Immigrants | Austria | 100.0 /100 | #37 | Exceptional 6.0% |
| Immigrants | Norway | 100.0 /100 | #38 | Exceptional 6.0% |
| Immigrants | South Africa | 100.0 /100 | #39 | Exceptional 6.0% |
| Cambodians | 100.0 /100 | #40 | Exceptional 6.0% |
| New Zealanders | 100.0 /100 | #41 | Exceptional 6.0% |
| Estonians | 100.0 /100 | #42 | Exceptional 6.0% |
| Immigrants | Saudi Arabia | 100.0 /100 | #43 | Exceptional 5.9% |
| Argentineans | 100.0 /100 | #44 | Exceptional 5.9% |
| Immigrants | South Central Asia | 100.0 /100 | #45 | Exceptional 5.9% |
| Immigrants | Argentina | 100.0 /100 | #46 | Exceptional 5.9% |
| Australians | 100.0 /100 | #47 | Exceptional 5.9% |