Immigrants from Albania vs Cambodian Professional Degree
COMPARE
Immigrants from Albania
Cambodian
Professional Degree
Professional Degree Comparison
Immigrants from Albania
Cambodians
4.8%
PROFESSIONAL DEGREE
93.3/ 100
METRIC RATING
125th/ 347
METRIC RANK
6.0%
PROFESSIONAL DEGREE
100.0/ 100
METRIC RATING
40th/ 347
METRIC RANK
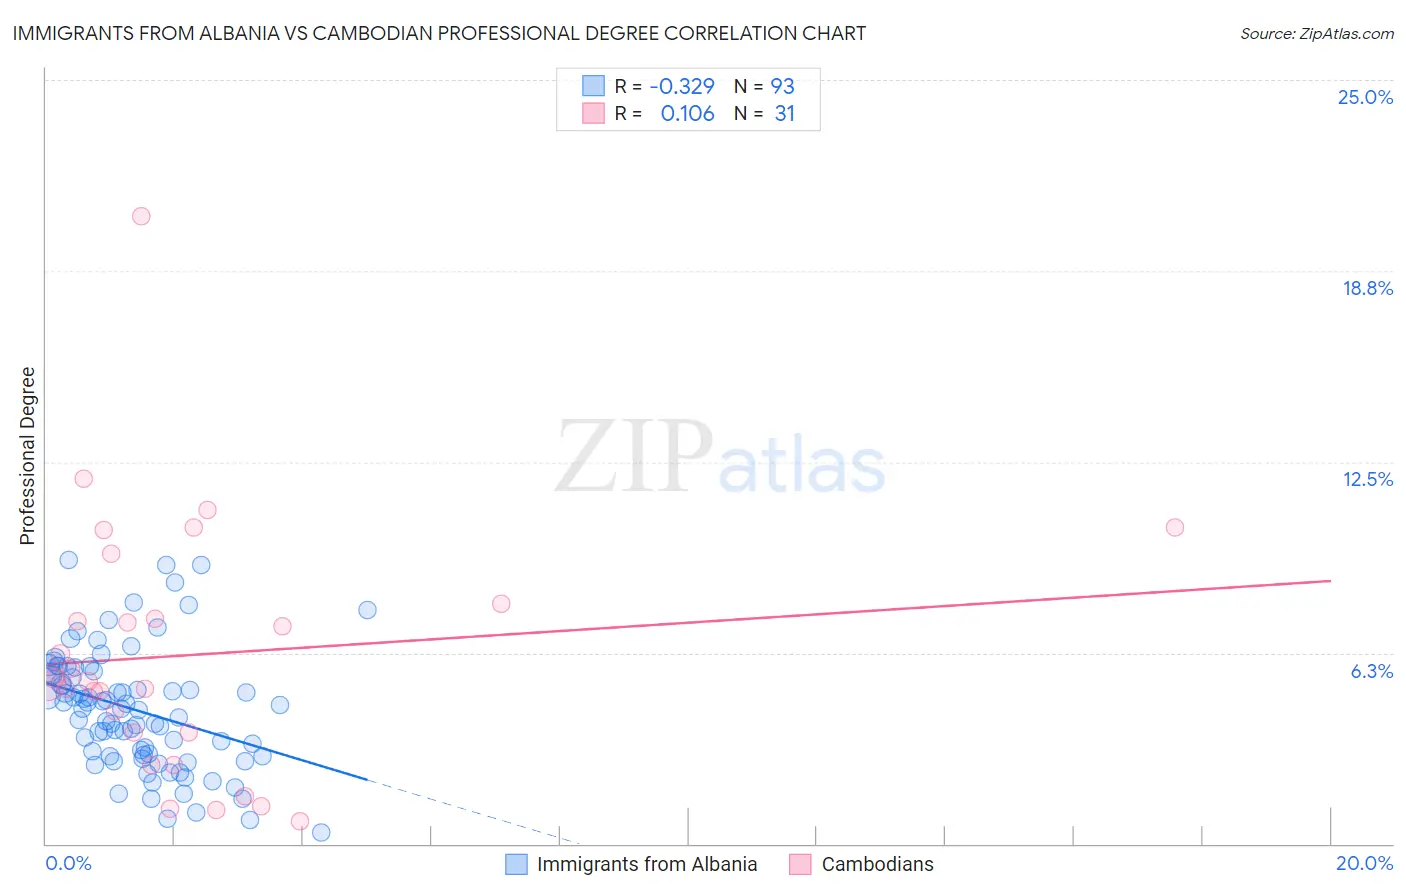
Immigrants from Albania vs Cambodian Professional Degree Correlation Chart
The statistical analysis conducted on geographies consisting of 119,335,838 people shows a mild negative correlation between the proportion of Immigrants from Albania and percentage of population with at least professional degree education in the United States with a correlation coefficient (R) of -0.329 and weighted average of 4.8%. Similarly, the statistical analysis conducted on geographies consisting of 102,442,026 people shows a poor positive correlation between the proportion of Cambodians and percentage of population with at least professional degree education in the United States with a correlation coefficient (R) of 0.106 and weighted average of 6.0%, a difference of 23.6%.
Professional Degree Correlation Summary
| Measurement | Immigrants from Albania | Cambodian |
| Minimum | 0.35% | 0.74% |
| Maximum | 9.3% | 20.5% |
| Range | 8.9% | 19.8% |
| Mean | 4.4% | 6.2% |
| Median | 4.4% | 5.3% |
| Interquartile 25% (IQ1) | 2.9% | 3.6% |
| Interquartile 75% (IQ3) | 5.6% | 7.9% |
| Interquartile Range (IQR) | 2.7% | 4.2% |
| Standard Deviation (Sample) | 2.0% | 4.1% |
| Standard Deviation (Population) | 1.9% | 4.0% |
Similar Demographics by Professional Degree
Demographics Similar to Immigrants from Albania by Professional Degree
In terms of professional degree, the demographic groups most similar to Immigrants from Albania are European (4.8%, a difference of 0.050%), Immigrants from Eritrea (4.8%, a difference of 0.12%), Immigrants from Venezuela (4.8%, a difference of 0.31%), Serbian (4.8%, a difference of 0.35%), and Immigrants from Eastern Africa (4.8%, a difference of 0.37%).
| Demographics | Rating | Rank | Professional Degree |
| Croatians | 96.0 /100 | #118 | Exceptional 4.9% |
| Immigrants | Sudan | 95.4 /100 | #119 | Exceptional 4.9% |
| Albanians | 95.3 /100 | #120 | Exceptional 4.9% |
| Immigrants | Moldova | 94.8 /100 | #121 | Exceptional 4.9% |
| Immigrants | Germany | 94.1 /100 | #122 | Exceptional 4.9% |
| Immigrants | Venezuela | 93.8 /100 | #123 | Exceptional 4.8% |
| Immigrants | Eritrea | 93.5 /100 | #124 | Exceptional 4.8% |
| Immigrants | Albania | 93.3 /100 | #125 | Exceptional 4.8% |
| Europeans | 93.2 /100 | #126 | Exceptional 4.8% |
| Serbians | 92.6 /100 | #127 | Exceptional 4.8% |
| Immigrants | Eastern Africa | 92.5 /100 | #128 | Exceptional 4.8% |
| Palestinians | 91.5 /100 | #129 | Exceptional 4.8% |
| Icelanders | 91.5 /100 | #130 | Exceptional 4.8% |
| Immigrants | Nepal | 91.4 /100 | #131 | Exceptional 4.8% |
| Pakistanis | 90.9 /100 | #132 | Exceptional 4.8% |
Demographics Similar to Cambodians by Professional Degree
In terms of professional degree, the demographic groups most similar to Cambodians are New Zealander (6.0%, a difference of 0.18%), Estonian (6.0%, a difference of 0.19%), Immigrants from South Africa (6.0%, a difference of 0.47%), Immigrants from Saudi Arabia (5.9%, a difference of 0.52%), and Argentinean (5.9%, a difference of 0.68%).
| Demographics | Rating | Rank | Professional Degree |
| Burmese | 100.0 /100 | #33 | Exceptional 6.1% |
| Mongolians | 100.0 /100 | #34 | Exceptional 6.1% |
| Immigrants | Korea | 100.0 /100 | #35 | Exceptional 6.1% |
| Immigrants | Russia | 100.0 /100 | #36 | Exceptional 6.0% |
| Immigrants | Austria | 100.0 /100 | #37 | Exceptional 6.0% |
| Immigrants | Norway | 100.0 /100 | #38 | Exceptional 6.0% |
| Immigrants | South Africa | 100.0 /100 | #39 | Exceptional 6.0% |
| Cambodians | 100.0 /100 | #40 | Exceptional 6.0% |
| New Zealanders | 100.0 /100 | #41 | Exceptional 6.0% |
| Estonians | 100.0 /100 | #42 | Exceptional 6.0% |
| Immigrants | Saudi Arabia | 100.0 /100 | #43 | Exceptional 5.9% |
| Argentineans | 100.0 /100 | #44 | Exceptional 5.9% |
| Immigrants | South Central Asia | 100.0 /100 | #45 | Exceptional 5.9% |
| Immigrants | Argentina | 100.0 /100 | #46 | Exceptional 5.9% |
| Australians | 100.0 /100 | #47 | Exceptional 5.9% |