Immigrants from Northern Africa vs Cambodian Professional Degree
COMPARE
Immigrants from Northern Africa
Cambodian
Professional Degree
Professional Degree Comparison
Immigrants from Northern Africa
Cambodians
5.1%
PROFESSIONAL DEGREE
98.4/ 100
METRIC RATING
103rd/ 347
METRIC RANK
6.0%
PROFESSIONAL DEGREE
100.0/ 100
METRIC RATING
40th/ 347
METRIC RANK
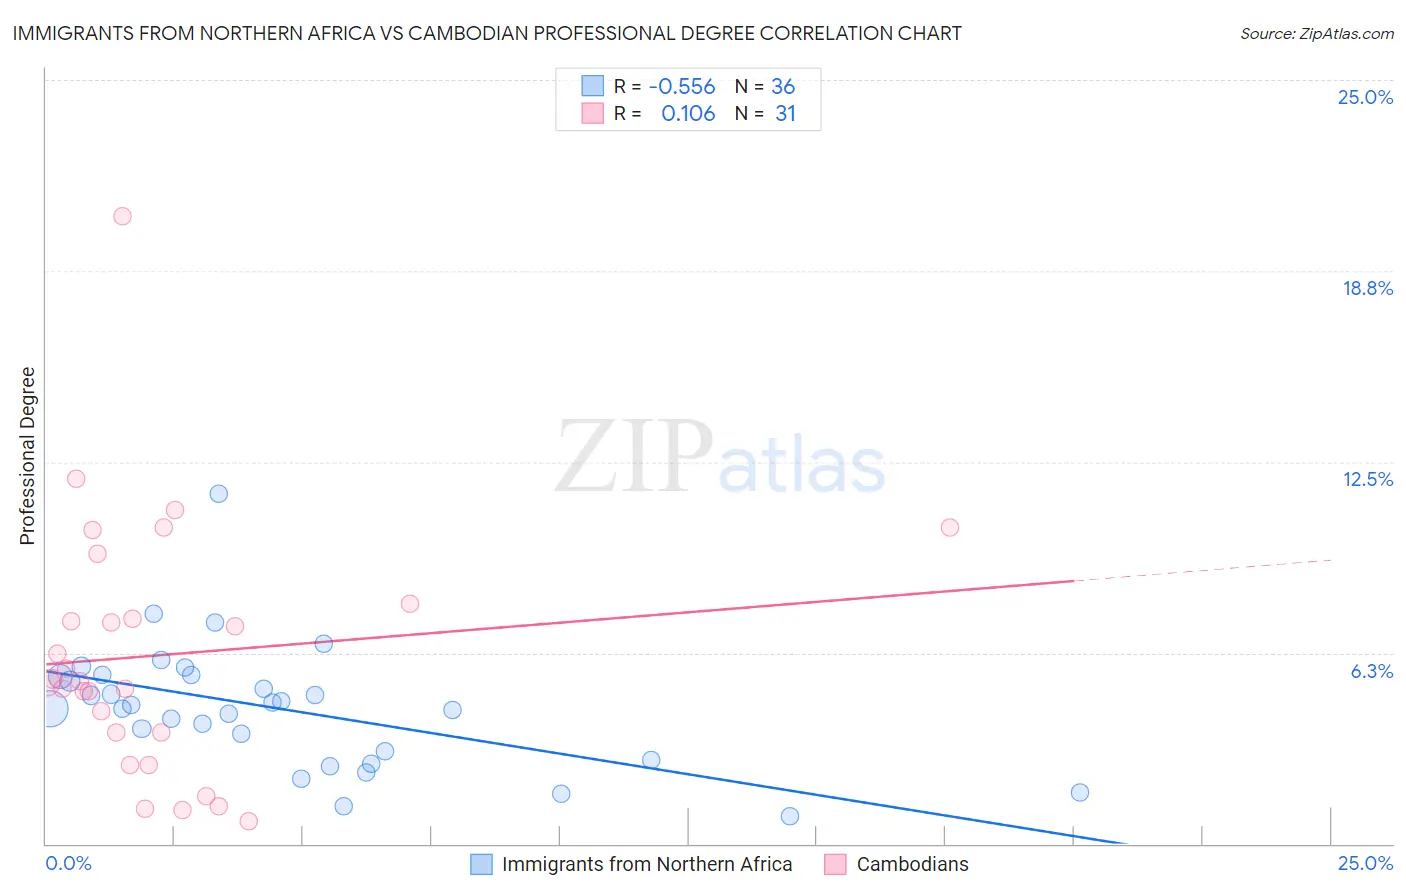
Immigrants from Northern Africa vs Cambodian Professional Degree Correlation Chart
The statistical analysis conducted on geographies consisting of 320,940,889 people shows a substantial negative correlation between the proportion of Immigrants from Northern Africa and percentage of population with at least professional degree education in the United States with a correlation coefficient (R) of -0.556 and weighted average of 5.1%. Similarly, the statistical analysis conducted on geographies consisting of 102,442,026 people shows a poor positive correlation between the proportion of Cambodians and percentage of population with at least professional degree education in the United States with a correlation coefficient (R) of 0.106 and weighted average of 6.0%, a difference of 17.9%.
Professional Degree Correlation Summary
| Measurement | Immigrants from Northern Africa | Cambodian |
| Minimum | 0.89% | 0.74% |
| Maximum | 11.4% | 20.5% |
| Range | 10.5% | 19.8% |
| Mean | 4.4% | 6.2% |
| Median | 4.5% | 5.3% |
| Interquartile 25% (IQ1) | 2.9% | 3.6% |
| Interquartile 75% (IQ3) | 5.5% | 7.9% |
| Interquartile Range (IQR) | 2.6% | 4.2% |
| Standard Deviation (Sample) | 2.0% | 4.1% |
| Standard Deviation (Population) | 2.0% | 4.0% |
Similar Demographics by Professional Degree
Demographics Similar to Immigrants from Northern Africa by Professional Degree
In terms of professional degree, the demographic groups most similar to Immigrants from Northern Africa are Ukrainian (5.1%, a difference of 0.25%), Arab (5.0%, a difference of 0.31%), Immigrants from Egypt (5.1%, a difference of 0.33%), Immigrants from Uganda (5.0%, a difference of 0.34%), and Immigrants from Ukraine (5.0%, a difference of 0.37%).
| Demographics | Rating | Rank | Professional Degree |
| Immigrants | Uzbekistan | 99.2 /100 | #96 | Exceptional 5.2% |
| Syrians | 99.1 /100 | #97 | Exceptional 5.2% |
| Austrians | 99.1 /100 | #98 | Exceptional 5.2% |
| Immigrants | Italy | 99.1 /100 | #99 | Exceptional 5.2% |
| Ugandans | 98.8 /100 | #100 | Exceptional 5.1% |
| Immigrants | Egypt | 98.5 /100 | #101 | Exceptional 5.1% |
| Ukrainians | 98.5 /100 | #102 | Exceptional 5.1% |
| Immigrants | Northern Africa | 98.4 /100 | #103 | Exceptional 5.1% |
| Arabs | 98.2 /100 | #104 | Exceptional 5.0% |
| Immigrants | Uganda | 98.2 /100 | #105 | Exceptional 5.0% |
| Immigrants | Ukraine | 98.2 /100 | #106 | Exceptional 5.0% |
| Maltese | 98.1 /100 | #107 | Exceptional 5.0% |
| Immigrants | Southern Europe | 98.1 /100 | #108 | Exceptional 5.0% |
| British | 98.0 /100 | #109 | Exceptional 5.0% |
| Lebanese | 98.0 /100 | #110 | Exceptional 5.0% |
Demographics Similar to Cambodians by Professional Degree
In terms of professional degree, the demographic groups most similar to Cambodians are New Zealander (6.0%, a difference of 0.18%), Estonian (6.0%, a difference of 0.19%), Immigrants from South Africa (6.0%, a difference of 0.47%), Immigrants from Saudi Arabia (5.9%, a difference of 0.52%), and Argentinean (5.9%, a difference of 0.68%).
| Demographics | Rating | Rank | Professional Degree |
| Burmese | 100.0 /100 | #33 | Exceptional 6.1% |
| Mongolians | 100.0 /100 | #34 | Exceptional 6.1% |
| Immigrants | Korea | 100.0 /100 | #35 | Exceptional 6.1% |
| Immigrants | Russia | 100.0 /100 | #36 | Exceptional 6.0% |
| Immigrants | Austria | 100.0 /100 | #37 | Exceptional 6.0% |
| Immigrants | Norway | 100.0 /100 | #38 | Exceptional 6.0% |
| Immigrants | South Africa | 100.0 /100 | #39 | Exceptional 6.0% |
| Cambodians | 100.0 /100 | #40 | Exceptional 6.0% |
| New Zealanders | 100.0 /100 | #41 | Exceptional 6.0% |
| Estonians | 100.0 /100 | #42 | Exceptional 6.0% |
| Immigrants | Saudi Arabia | 100.0 /100 | #43 | Exceptional 5.9% |
| Argentineans | 100.0 /100 | #44 | Exceptional 5.9% |
| Immigrants | South Central Asia | 100.0 /100 | #45 | Exceptional 5.9% |
| Immigrants | Argentina | 100.0 /100 | #46 | Exceptional 5.9% |
| Australians | 100.0 /100 | #47 | Exceptional 5.9% |