Costa Rican vs Immigrants from Indonesia 9th Grade
COMPARE
Costa Rican
Immigrants from Indonesia
9th Grade
9th Grade Comparison
Costa Ricans
Immigrants from Indonesia
94.3%
9TH GRADE
3.5/ 100
METRIC RATING
234th/ 347
METRIC RANK
94.5%
9TH GRADE
12.3/ 100
METRIC RATING
211th/ 347
METRIC RANK
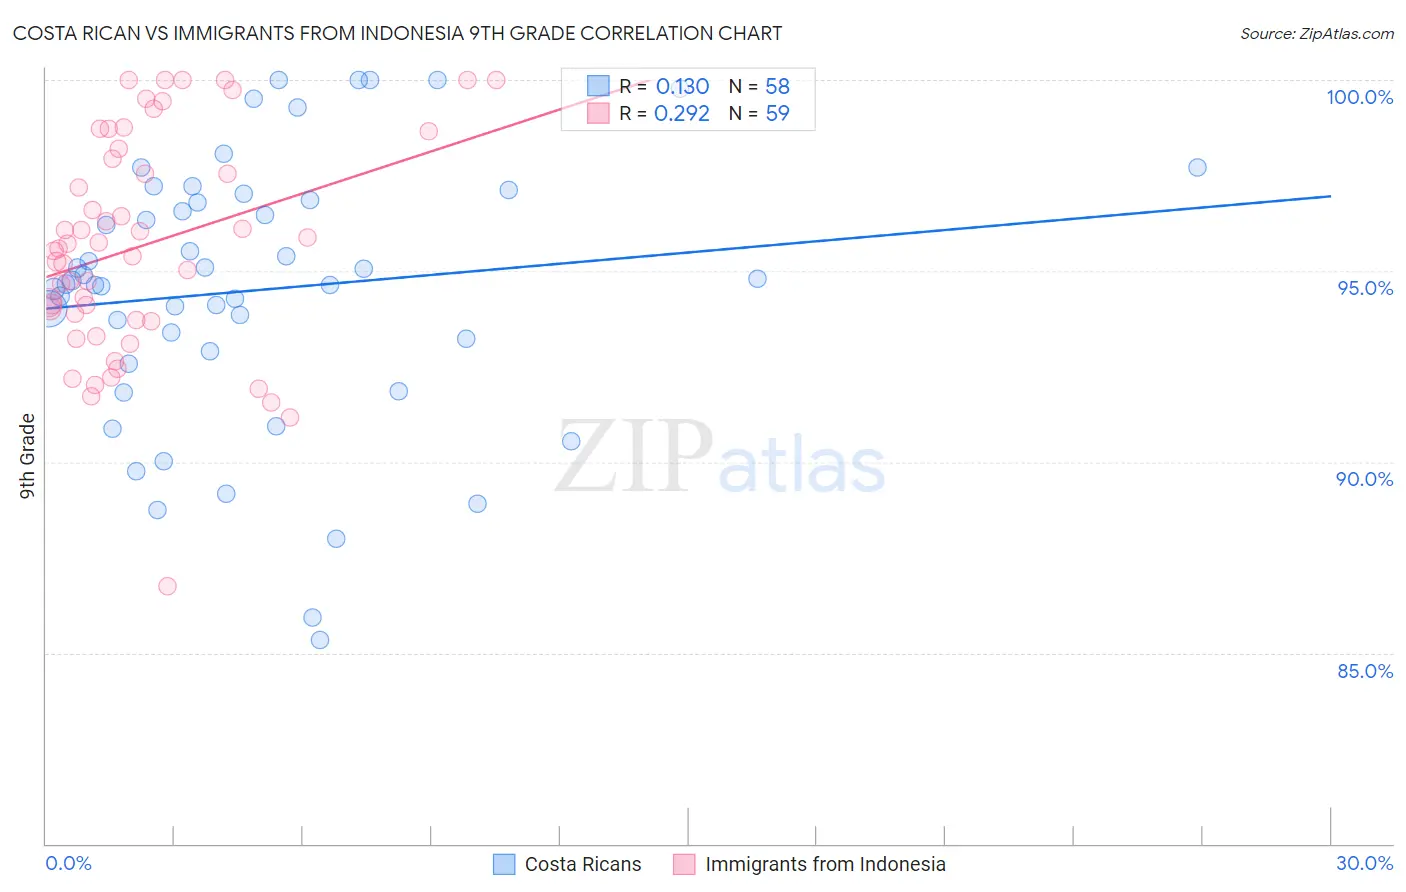
Costa Rican vs Immigrants from Indonesia 9th Grade Correlation Chart
The statistical analysis conducted on geographies consisting of 253,601,730 people shows a poor positive correlation between the proportion of Costa Ricans and percentage of population with at least 9th grade education in the United States with a correlation coefficient (R) of 0.130 and weighted average of 94.3%. Similarly, the statistical analysis conducted on geographies consisting of 215,671,959 people shows a weak positive correlation between the proportion of Immigrants from Indonesia and percentage of population with at least 9th grade education in the United States with a correlation coefficient (R) of 0.292 and weighted average of 94.5%, a difference of 0.25%.
9th Grade Correlation Summary
| Measurement | Costa Rican | Immigrants from Indonesia |
| Minimum | 85.3% | 86.7% |
| Maximum | 100.0% | 100.0% |
| Range | 14.7% | 13.3% |
| Mean | 94.5% | 95.7% |
| Median | 94.7% | 95.6% |
| Interquartile 25% (IQ1) | 92.9% | 93.7% |
| Interquartile 75% (IQ3) | 96.9% | 98.2% |
| Interquartile Range (IQR) | 4.0% | 4.5% |
| Standard Deviation (Sample) | 3.5% | 2.9% |
| Standard Deviation (Population) | 3.4% | 2.9% |
Similar Demographics by 9th Grade
Demographics Similar to Costa Ricans by 9th Grade
In terms of 9th grade, the demographic groups most similar to Costa Ricans are Nigerian (94.3%, a difference of 0.010%), Bolivian (94.3%, a difference of 0.010%), Immigrants from Panama (94.3%, a difference of 0.020%), Immigrants from Africa (94.3%, a difference of 0.020%), and Apache (94.3%, a difference of 0.030%).
| Demographics | Rating | Rank | 9th Grade |
| Immigrants | Sierra Leone | 4.8 /100 | #227 | Tragic 94.4% |
| Lumbee | 4.7 /100 | #228 | Tragic 94.4% |
| Immigrants | Southern Europe | 4.5 /100 | #229 | Tragic 94.3% |
| Apache | 4.2 /100 | #230 | Tragic 94.3% |
| Immigrants | Panama | 4.0 /100 | #231 | Tragic 94.3% |
| Immigrants | Africa | 3.9 /100 | #232 | Tragic 94.3% |
| Nigerians | 3.7 /100 | #233 | Tragic 94.3% |
| Costa Ricans | 3.5 /100 | #234 | Tragic 94.3% |
| Bolivians | 3.3 /100 | #235 | Tragic 94.3% |
| Somalis | 2.9 /100 | #236 | Tragic 94.3% |
| Koreans | 2.9 /100 | #237 | Tragic 94.3% |
| South American Indians | 2.8 /100 | #238 | Tragic 94.3% |
| Immigrants | China | 2.8 /100 | #239 | Tragic 94.3% |
| Immigrants | Ethiopia | 2.7 /100 | #240 | Tragic 94.3% |
| Spanish Americans | 2.6 /100 | #241 | Tragic 94.2% |
Demographics Similar to Immigrants from Indonesia by 9th Grade
In terms of 9th grade, the demographic groups most similar to Immigrants from Indonesia are Immigrants from Malaysia (94.5%, a difference of 0.0%), Immigrants from Oceania (94.5%, a difference of 0.0%), Immigrants from Liberia (94.5%, a difference of 0.010%), Immigrants from Chile (94.5%, a difference of 0.020%), and Immigrants from Syria (94.5%, a difference of 0.020%).
| Demographics | Rating | Rank | 9th Grade |
| Moroccans | 19.6 /100 | #204 | Poor 94.6% |
| Immigrants | Sudan | 17.6 /100 | #205 | Poor 94.6% |
| Samoans | 17.3 /100 | #206 | Poor 94.6% |
| Immigrants | Morocco | 16.3 /100 | #207 | Poor 94.6% |
| Immigrants | Pakistan | 15.5 /100 | #208 | Poor 94.6% |
| Comanche | 14.9 /100 | #209 | Poor 94.6% |
| Immigrants | Chile | 13.4 /100 | #210 | Poor 94.5% |
| Immigrants | Indonesia | 12.3 /100 | #211 | Poor 94.5% |
| Immigrants | Malaysia | 12.2 /100 | #212 | Poor 94.5% |
| Immigrants | Oceania | 12.1 /100 | #213 | Poor 94.5% |
| Immigrants | Liberia | 11.8 /100 | #214 | Poor 94.5% |
| Immigrants | Syria | 11.0 /100 | #215 | Poor 94.5% |
| Immigrants | Western Asia | 10.7 /100 | #216 | Poor 94.5% |
| Asians | 9.9 /100 | #217 | Tragic 94.5% |
| Portuguese | 9.2 /100 | #218 | Tragic 94.5% |