Yugoslavian vs Immigrants from Indonesia 9th Grade
COMPARE
Yugoslavian
Immigrants from Indonesia
9th Grade
9th Grade Comparison
Yugoslavians
Immigrants from Indonesia
95.7%
9TH GRADE
98.9/ 100
METRIC RATING
89th/ 347
METRIC RANK
94.5%
9TH GRADE
12.3/ 100
METRIC RATING
211th/ 347
METRIC RANK
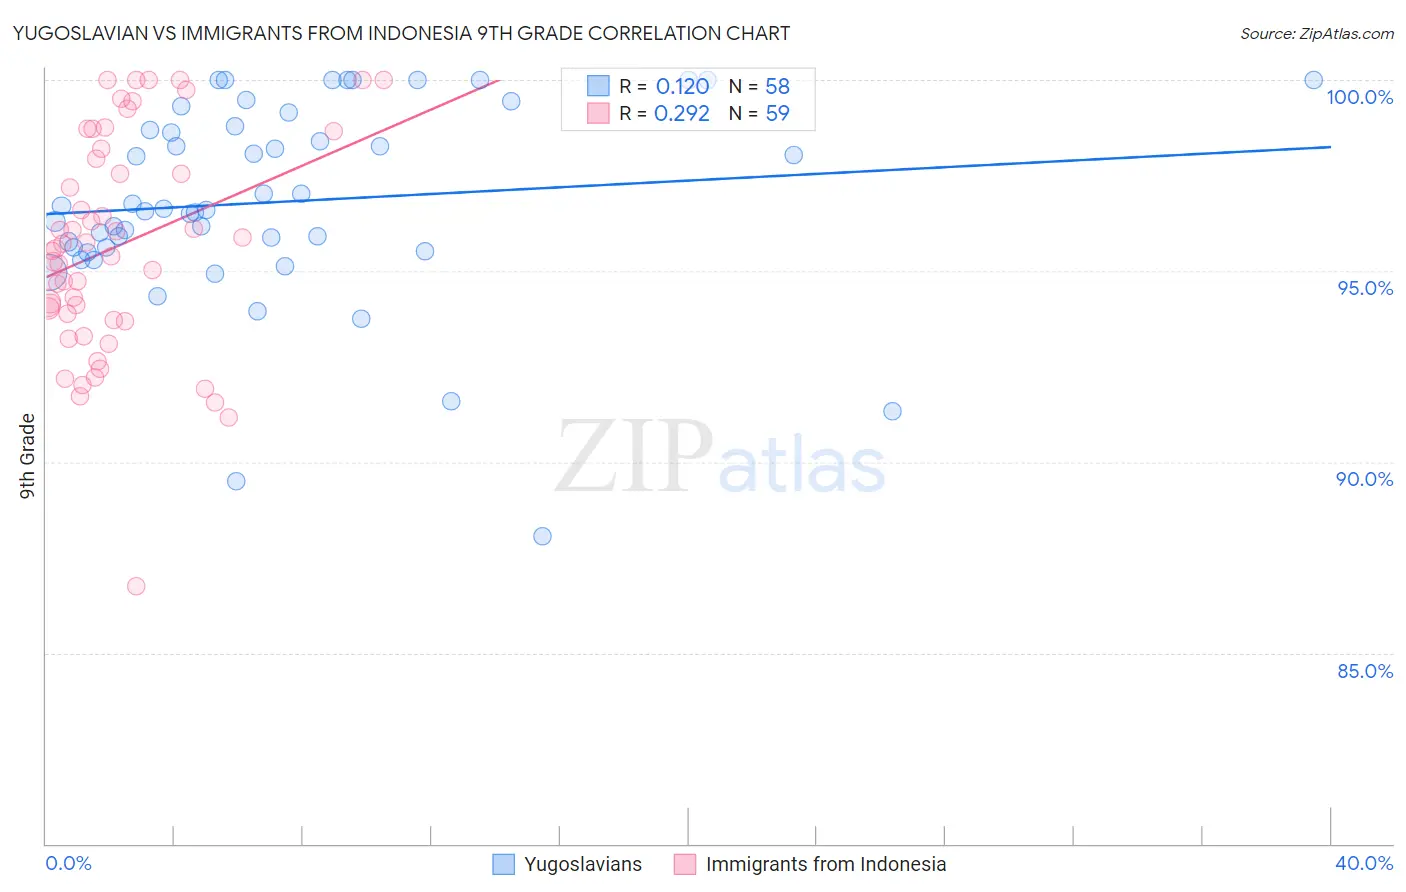
Yugoslavian vs Immigrants from Indonesia 9th Grade Correlation Chart
The statistical analysis conducted on geographies consisting of 285,683,014 people shows a poor positive correlation between the proportion of Yugoslavians and percentage of population with at least 9th grade education in the United States with a correlation coefficient (R) of 0.120 and weighted average of 95.7%. Similarly, the statistical analysis conducted on geographies consisting of 215,671,959 people shows a weak positive correlation between the proportion of Immigrants from Indonesia and percentage of population with at least 9th grade education in the United States with a correlation coefficient (R) of 0.292 and weighted average of 94.5%, a difference of 1.2%.
9th Grade Correlation Summary
| Measurement | Yugoslavian | Immigrants from Indonesia |
| Minimum | 88.0% | 86.7% |
| Maximum | 100.0% | 100.0% |
| Range | 12.0% | 13.3% |
| Mean | 96.8% | 95.7% |
| Median | 96.6% | 95.6% |
| Interquartile 25% (IQ1) | 95.6% | 93.7% |
| Interquartile 75% (IQ3) | 98.8% | 98.2% |
| Interquartile Range (IQR) | 3.2% | 4.5% |
| Standard Deviation (Sample) | 2.6% | 2.9% |
| Standard Deviation (Population) | 2.6% | 2.9% |
Similar Demographics by 9th Grade
Demographics Similar to Yugoslavians by 9th Grade
In terms of 9th grade, the demographic groups most similar to Yugoslavians are Immigrants from Czechoslovakia (95.7%, a difference of 0.0%), South African (95.6%, a difference of 0.010%), Creek (95.6%, a difference of 0.010%), Okinawan (95.7%, a difference of 0.020%), and Immigrants from Saudi Arabia (95.6%, a difference of 0.020%).
| Demographics | Rating | Rank | 9th Grade |
| Puget Sound Salish | 99.2 /100 | #82 | Exceptional 95.7% |
| Swiss | 99.2 /100 | #83 | Exceptional 95.7% |
| Immigrants | Denmark | 99.1 /100 | #84 | Exceptional 95.7% |
| Icelanders | 99.1 /100 | #85 | Exceptional 95.7% |
| Immigrants | Western Europe | 99.1 /100 | #86 | Exceptional 95.7% |
| Okinawans | 99.0 /100 | #87 | Exceptional 95.7% |
| Immigrants | Czechoslovakia | 98.9 /100 | #88 | Exceptional 95.7% |
| Yugoslavians | 98.9 /100 | #89 | Exceptional 95.7% |
| South Africans | 98.8 /100 | #90 | Exceptional 95.6% |
| Creek | 98.8 /100 | #91 | Exceptional 95.6% |
| Immigrants | Saudi Arabia | 98.8 /100 | #92 | Exceptional 95.6% |
| Immigrants | Germany | 98.7 /100 | #93 | Exceptional 95.6% |
| Immigrants | Latvia | 98.7 /100 | #94 | Exceptional 95.6% |
| Americans | 98.5 /100 | #95 | Exceptional 95.6% |
| Filipinos | 98.5 /100 | #96 | Exceptional 95.6% |
Demographics Similar to Immigrants from Indonesia by 9th Grade
In terms of 9th grade, the demographic groups most similar to Immigrants from Indonesia are Immigrants from Malaysia (94.5%, a difference of 0.0%), Immigrants from Oceania (94.5%, a difference of 0.0%), Immigrants from Liberia (94.5%, a difference of 0.010%), Immigrants from Chile (94.5%, a difference of 0.020%), and Immigrants from Syria (94.5%, a difference of 0.020%).
| Demographics | Rating | Rank | 9th Grade |
| Moroccans | 19.6 /100 | #204 | Poor 94.6% |
| Immigrants | Sudan | 17.6 /100 | #205 | Poor 94.6% |
| Samoans | 17.3 /100 | #206 | Poor 94.6% |
| Immigrants | Morocco | 16.3 /100 | #207 | Poor 94.6% |
| Immigrants | Pakistan | 15.5 /100 | #208 | Poor 94.6% |
| Comanche | 14.9 /100 | #209 | Poor 94.6% |
| Immigrants | Chile | 13.4 /100 | #210 | Poor 94.5% |
| Immigrants | Indonesia | 12.3 /100 | #211 | Poor 94.5% |
| Immigrants | Malaysia | 12.2 /100 | #212 | Poor 94.5% |
| Immigrants | Oceania | 12.1 /100 | #213 | Poor 94.5% |
| Immigrants | Liberia | 11.8 /100 | #214 | Poor 94.5% |
| Immigrants | Syria | 11.0 /100 | #215 | Poor 94.5% |
| Immigrants | Western Asia | 10.7 /100 | #216 | Poor 94.5% |
| Asians | 9.9 /100 | #217 | Tragic 94.5% |
| Portuguese | 9.2 /100 | #218 | Tragic 94.5% |