Okinawan vs Immigrants from Afghanistan High School Diploma
COMPARE
Okinawan
Immigrants from Afghanistan
High School Diploma
High School Diploma Comparison
Okinawans
Immigrants from Afghanistan
91.4%
HIGH SCHOOL DIPLOMA
99.9/ 100
METRIC RATING
33rd/ 347
METRIC RANK
88.3%
HIGH SCHOOL DIPLOMA
8.6/ 100
METRIC RATING
221st/ 347
METRIC RANK
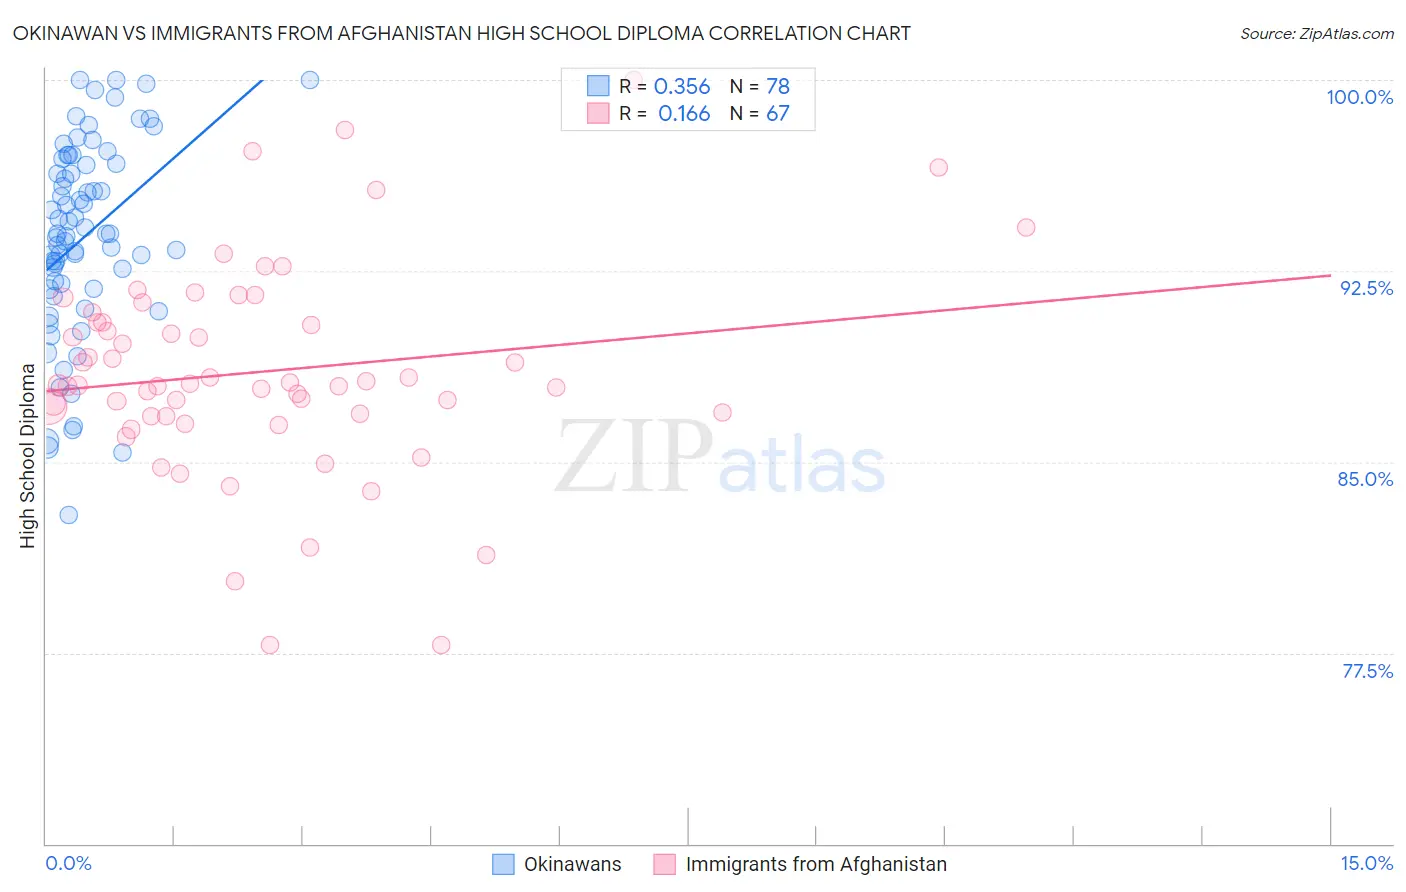
Okinawan vs Immigrants from Afghanistan High School Diploma Correlation Chart
The statistical analysis conducted on geographies consisting of 73,775,797 people shows a mild positive correlation between the proportion of Okinawans and percentage of population with at least high school diploma education in the United States with a correlation coefficient (R) of 0.356 and weighted average of 91.4%. Similarly, the statistical analysis conducted on geographies consisting of 147,629,579 people shows a poor positive correlation between the proportion of Immigrants from Afghanistan and percentage of population with at least high school diploma education in the United States with a correlation coefficient (R) of 0.166 and weighted average of 88.3%, a difference of 3.5%.
High School Diploma Correlation Summary
| Measurement | Okinawan | Immigrants from Afghanistan |
| Minimum | 82.9% | 77.8% |
| Maximum | 100.0% | 100.0% |
| Range | 17.1% | 22.2% |
| Mean | 93.8% | 88.5% |
| Median | 94.0% | 88.0% |
| Interquartile 25% (IQ1) | 91.8% | 86.8% |
| Interquartile 75% (IQ3) | 96.7% | 90.5% |
| Interquartile Range (IQR) | 4.9% | 3.7% |
| Standard Deviation (Sample) | 3.9% | 4.1% |
| Standard Deviation (Population) | 3.8% | 4.1% |
Similar Demographics by High School Diploma
Demographics Similar to Okinawans by High School Diploma
In terms of high school diploma, the demographic groups most similar to Okinawans are Iranian (91.4%, a difference of 0.010%), Immigrants from Northern Europe (91.4%, a difference of 0.010%), English (91.4%, a difference of 0.010%), Scottish (91.4%, a difference of 0.010%), and European (91.4%, a difference of 0.020%).
| Demographics | Rating | Rank | High School Diploma |
| Russians | 99.9 /100 | #26 | Exceptional 91.5% |
| Cypriots | 99.9 /100 | #27 | Exceptional 91.5% |
| Tlingit-Haida | 99.9 /100 | #28 | Exceptional 91.4% |
| Europeans | 99.9 /100 | #29 | Exceptional 91.4% |
| Iranians | 99.9 /100 | #30 | Exceptional 91.4% |
| Immigrants | Northern Europe | 99.9 /100 | #31 | Exceptional 91.4% |
| English | 99.9 /100 | #32 | Exceptional 91.4% |
| Okinawans | 99.9 /100 | #33 | Exceptional 91.4% |
| Scottish | 99.9 /100 | #34 | Exceptional 91.4% |
| Irish | 99.9 /100 | #35 | Exceptional 91.4% |
| Tsimshian | 99.9 /100 | #36 | Exceptional 91.3% |
| Immigrants | Ireland | 99.9 /100 | #37 | Exceptional 91.3% |
| Immigrants | Scotland | 99.8 /100 | #38 | Exceptional 91.3% |
| Dutch | 99.8 /100 | #39 | Exceptional 91.3% |
| Immigrants | Lithuania | 99.8 /100 | #40 | Exceptional 91.3% |
Demographics Similar to Immigrants from Afghanistan by High School Diploma
In terms of high school diploma, the demographic groups most similar to Immigrants from Afghanistan are Tongan (88.4%, a difference of 0.040%), Colville (88.3%, a difference of 0.040%), Costa Rican (88.4%, a difference of 0.050%), Immigrants from Zaire (88.3%, a difference of 0.050%), and Immigrants from Bolivia (88.4%, a difference of 0.070%).
| Demographics | Rating | Rank | High School Diploma |
| Immigrants | Cameroon | 10.9 /100 | #214 | Poor 88.4% |
| Crow | 10.9 /100 | #215 | Poor 88.4% |
| Chickasaw | 10.7 /100 | #216 | Poor 88.4% |
| Immigrants | Africa | 10.6 /100 | #217 | Poor 88.4% |
| Immigrants | Bolivia | 10.3 /100 | #218 | Poor 88.4% |
| Costa Ricans | 9.6 /100 | #219 | Tragic 88.4% |
| Tongans | 9.5 /100 | #220 | Tragic 88.4% |
| Immigrants | Afghanistan | 8.6 /100 | #221 | Tragic 88.3% |
| Colville | 7.8 /100 | #222 | Tragic 88.3% |
| Immigrants | Zaire | 7.6 /100 | #223 | Tragic 88.3% |
| Shoshone | 7.0 /100 | #224 | Tragic 88.3% |
| Creek | 6.9 /100 | #225 | Tragic 88.3% |
| Uruguayans | 5.6 /100 | #226 | Tragic 88.2% |
| Immigrants | Liberia | 5.5 /100 | #227 | Tragic 88.2% |
| Kiowa | 5.3 /100 | #228 | Tragic 88.2% |