Northern European vs Slovak Associate's Degree
COMPARE
Northern European
Slovak
Associate's Degree
Associate's Degree Comparison
Northern Europeans
Slovaks
49.5%
ASSOCIATE'S DEGREE
97.3/ 100
METRIC RATING
101st/ 347
METRIC RANK
46.3%
ASSOCIATE'S DEGREE
48.4/ 100
METRIC RATING
177th/ 347
METRIC RANK
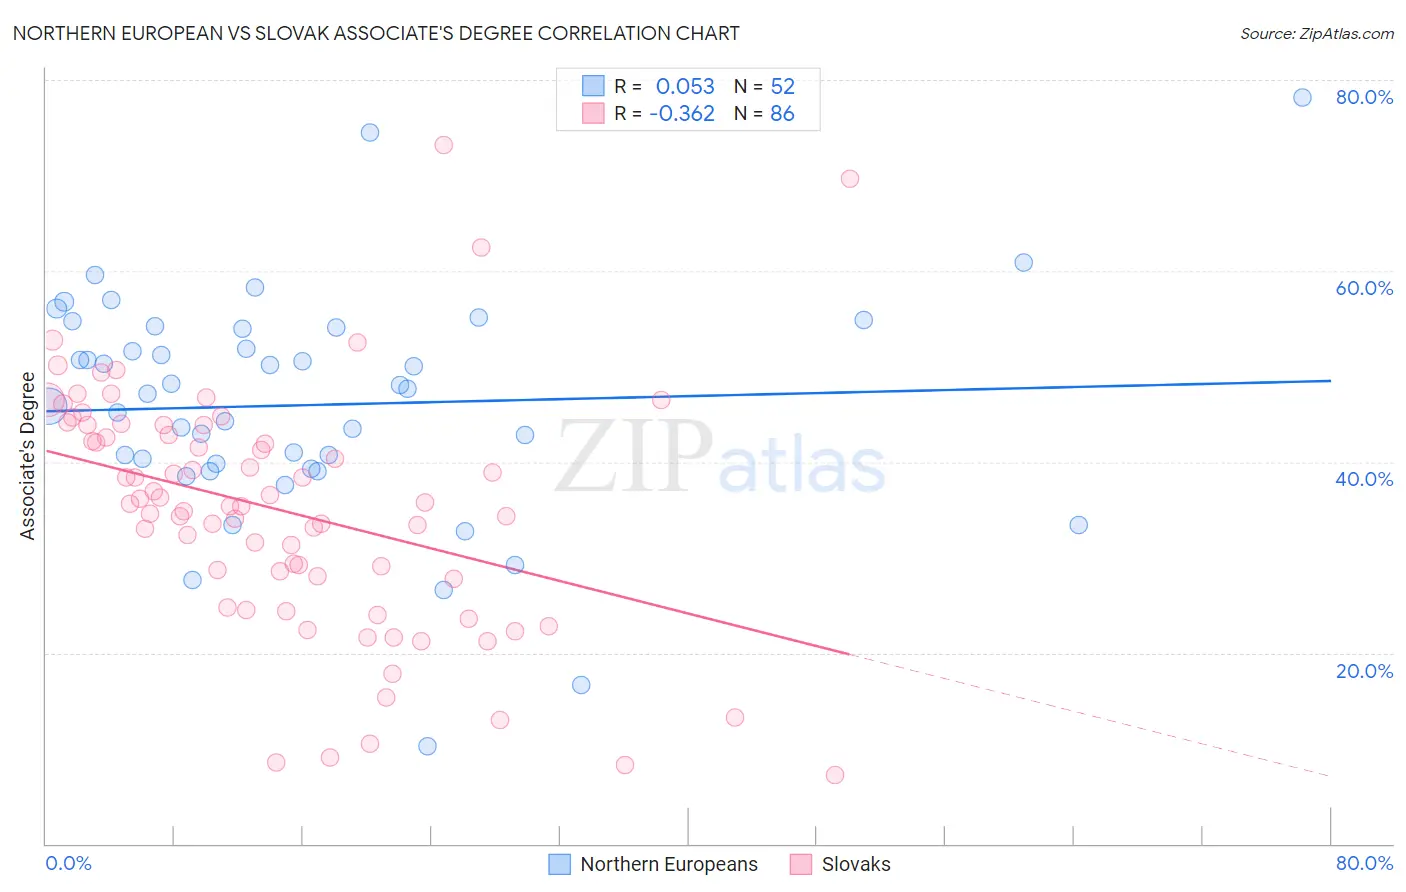
Northern European vs Slovak Associate's Degree Correlation Chart
The statistical analysis conducted on geographies consisting of 406,085,887 people shows a slight positive correlation between the proportion of Northern Europeans and percentage of population with at least associate's degree education in the United States with a correlation coefficient (R) of 0.053 and weighted average of 49.5%. Similarly, the statistical analysis conducted on geographies consisting of 397,875,693 people shows a mild negative correlation between the proportion of Slovaks and percentage of population with at least associate's degree education in the United States with a correlation coefficient (R) of -0.362 and weighted average of 46.3%, a difference of 6.8%.
Associate's Degree Correlation Summary
| Measurement | Northern European | Slovak |
| Minimum | 10.2% | 7.1% |
| Maximum | 78.2% | 73.2% |
| Range | 68.0% | 66.0% |
| Mean | 46.0% | 34.9% |
| Median | 47.4% | 35.4% |
| Interquartile 25% (IQ1) | 39.6% | 27.8% |
| Interquartile 75% (IQ3) | 54.0% | 43.8% |
| Interquartile Range (IQR) | 14.4% | 16.1% |
| Standard Deviation (Sample) | 12.1% | 12.8% |
| Standard Deviation (Population) | 12.0% | 12.7% |
Similar Demographics by Associate's Degree
Demographics Similar to Northern Europeans by Associate's Degree
In terms of associate's degree, the demographic groups most similar to Northern Europeans are Chilean (49.4%, a difference of 0.030%), Ukrainian (49.4%, a difference of 0.13%), Immigrants from Nepal (49.5%, a difference of 0.16%), Venezuelan (49.4%, a difference of 0.20%), and Croatian (49.3%, a difference of 0.34%).
| Demographics | Rating | Rank | Associate's Degree |
| Laotians | 98.4 /100 | #94 | Exceptional 49.9% |
| Immigrants | England | 98.0 /100 | #95 | Exceptional 49.7% |
| Romanians | 98.0 /100 | #96 | Exceptional 49.7% |
| Immigrants | Ukraine | 98.0 /100 | #97 | Exceptional 49.7% |
| Immigrants | Northern Africa | 97.9 /100 | #98 | Exceptional 49.7% |
| Macedonians | 97.8 /100 | #99 | Exceptional 49.6% |
| Immigrants | Nepal | 97.5 /100 | #100 | Exceptional 49.5% |
| Northern Europeans | 97.3 /100 | #101 | Exceptional 49.5% |
| Chileans | 97.3 /100 | #102 | Exceptional 49.4% |
| Ukrainians | 97.1 /100 | #103 | Exceptional 49.4% |
| Venezuelans | 97.0 /100 | #104 | Exceptional 49.4% |
| Croatians | 96.8 /100 | #105 | Exceptional 49.3% |
| Immigrants | Italy | 96.7 /100 | #106 | Exceptional 49.3% |
| Syrians | 96.7 /100 | #107 | Exceptional 49.3% |
| Jordanians | 96.6 /100 | #108 | Exceptional 49.2% |
Demographics Similar to Slovaks by Associate's Degree
In terms of associate's degree, the demographic groups most similar to Slovaks are Finnish (46.3%, a difference of 0.010%), Immigrants from Bosnia and Herzegovina (46.3%, a difference of 0.010%), Belgian (46.3%, a difference of 0.040%), Sri Lankan (46.3%, a difference of 0.060%), and English (46.4%, a difference of 0.12%).
| Demographics | Rating | Rank | Associate's Degree |
| Irish | 53.6 /100 | #170 | Average 46.5% |
| Basques | 52.8 /100 | #171 | Average 46.5% |
| Peruvians | 50.5 /100 | #172 | Average 46.4% |
| Immigrants | Iraq | 50.3 /100 | #173 | Average 46.4% |
| English | 50.0 /100 | #174 | Average 46.4% |
| Belgians | 48.9 /100 | #175 | Average 46.3% |
| Finns | 48.5 /100 | #176 | Average 46.3% |
| Slovaks | 48.4 /100 | #177 | Average 46.3% |
| Immigrants | Bosnia and Herzegovina | 48.3 /100 | #178 | Average 46.3% |
| Sri Lankans | 47.6 /100 | #179 | Average 46.3% |
| Bermudans | 46.4 /100 | #180 | Average 46.2% |
| Immigrants | Colombia | 41.3 /100 | #181 | Average 46.0% |
| Swiss | 40.4 /100 | #182 | Average 46.0% |
| Yugoslavians | 40.2 /100 | #183 | Average 46.0% |
| Czechoslovakians | 40.0 /100 | #184 | Average 46.0% |