Nonimmigrants vs Immigrants from India Nursery School
COMPARE
Nonimmigrants
Immigrants from India
Nursery School
Nursery School Comparison
Nonimmigrants
Immigrants from India
98.3%
NURSERY SCHOOL
98.3/ 100
METRIC RATING
97th/ 347
METRIC RANK
98.3%
NURSERY SCHOOL
98.7/ 100
METRIC RATING
93rd/ 347
METRIC RANK
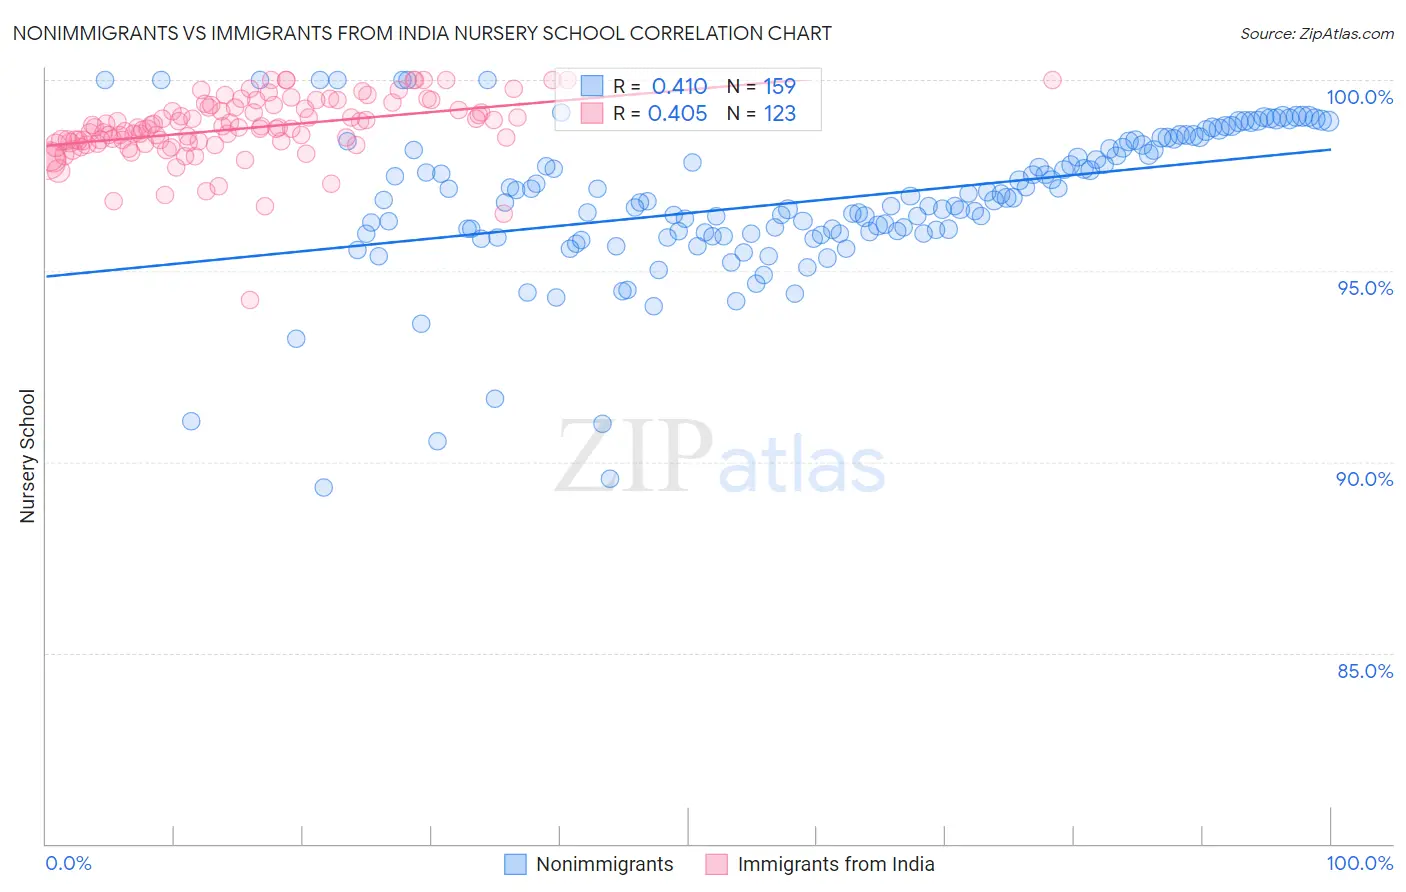
Nonimmigrants vs Immigrants from India Nursery School Correlation Chart
The statistical analysis conducted on geographies consisting of 585,374,774 people shows a moderate positive correlation between the proportion of Nonimmigrants and percentage of population with at least nursery school education in the United States with a correlation coefficient (R) of 0.410 and weighted average of 98.3%. Similarly, the statistical analysis conducted on geographies consisting of 434,105,844 people shows a moderate positive correlation between the proportion of Immigrants from India and percentage of population with at least nursery school education in the United States with a correlation coefficient (R) of 0.405 and weighted average of 98.3%, a difference of 0.020%.
Nursery School Correlation Summary
| Measurement | Nonimmigrants | Immigrants from India |
| Minimum | 89.3% | 94.2% |
| Maximum | 100.0% | 100.0% |
| Range | 10.7% | 5.8% |
| Mean | 96.8% | 98.7% |
| Median | 96.8% | 98.7% |
| Interquartile 25% (IQ1) | 96.0% | 98.4% |
| Interquartile 75% (IQ3) | 98.3% | 99.3% |
| Interquartile Range (IQR) | 2.3% | 0.92% |
| Standard Deviation (Sample) | 1.9% | 0.85% |
| Standard Deviation (Population) | 1.9% | 0.84% |
Demographics Similar to Nonimmigrants and Immigrants from India by Nursery School
In terms of nursery school, the demographic groups most similar to Nonimmigrants are Cypriot (98.3%, a difference of 0.0%), Choctaw (98.3%, a difference of 0.0%), Immigrants from Germany (98.3%, a difference of 0.010%), South African (98.3%, a difference of 0.010%), and Colville (98.3%, a difference of 0.010%). Similarly, the demographic groups most similar to Immigrants from India are Macedonian (98.3%, a difference of 0.0%), Hopi (98.3%, a difference of 0.010%), Ukrainian (98.3%, a difference of 0.010%), Immigrants from South Africa (98.3%, a difference of 0.010%), and Immigrants from Western Europe (98.3%, a difference of 0.010%).
| Demographics | Rating | Rank | Nursery School |
| Immigrants | Sweden | 99.1 /100 | #85 | Exceptional 98.3% |
| Immigrants | Australia | 99.0 /100 | #86 | Exceptional 98.3% |
| Hopi | 98.9 /100 | #87 | Exceptional 98.3% |
| Ukrainians | 98.9 /100 | #88 | Exceptional 98.3% |
| Immigrants | South Africa | 98.8 /100 | #89 | Exceptional 98.3% |
| Immigrants | Western Europe | 98.8 /100 | #90 | Exceptional 98.3% |
| Zimbabweans | 98.8 /100 | #91 | Exceptional 98.3% |
| Macedonians | 98.7 /100 | #92 | Exceptional 98.3% |
| Immigrants | India | 98.7 /100 | #93 | Exceptional 98.3% |
| Immigrants | Germany | 98.6 /100 | #94 | Exceptional 98.3% |
| South Africans | 98.6 /100 | #95 | Exceptional 98.3% |
| Cypriots | 98.3 /100 | #96 | Exceptional 98.3% |
| Immigrants | Nonimmigrants | 98.3 /100 | #97 | Exceptional 98.3% |
| Choctaw | 98.3 /100 | #98 | Exceptional 98.3% |
| Colville | 98.2 /100 | #99 | Exceptional 98.3% |
| Puget Sound Salish | 98.0 /100 | #100 | Exceptional 98.3% |
| Romanians | 97.9 /100 | #101 | Exceptional 98.3% |
| Immigrants | Ireland | 97.7 /100 | #102 | Exceptional 98.3% |
| Cree | 97.7 /100 | #103 | Exceptional 98.3% |
| Bhutanese | 97.4 /100 | #104 | Exceptional 98.2% |
| Turks | 97.4 /100 | #105 | Exceptional 98.2% |