Nonimmigrants vs Houma Nursery School
COMPARE
Nonimmigrants
Houma
Nursery School
Nursery School Comparison
Nonimmigrants
Houma
98.3%
NURSERY SCHOOL
98.3/ 100
METRIC RATING
97th/ 347
METRIC RANK
97.3%
NURSERY SCHOOL
0.0/ 100
METRIC RATING
292nd/ 347
METRIC RANK
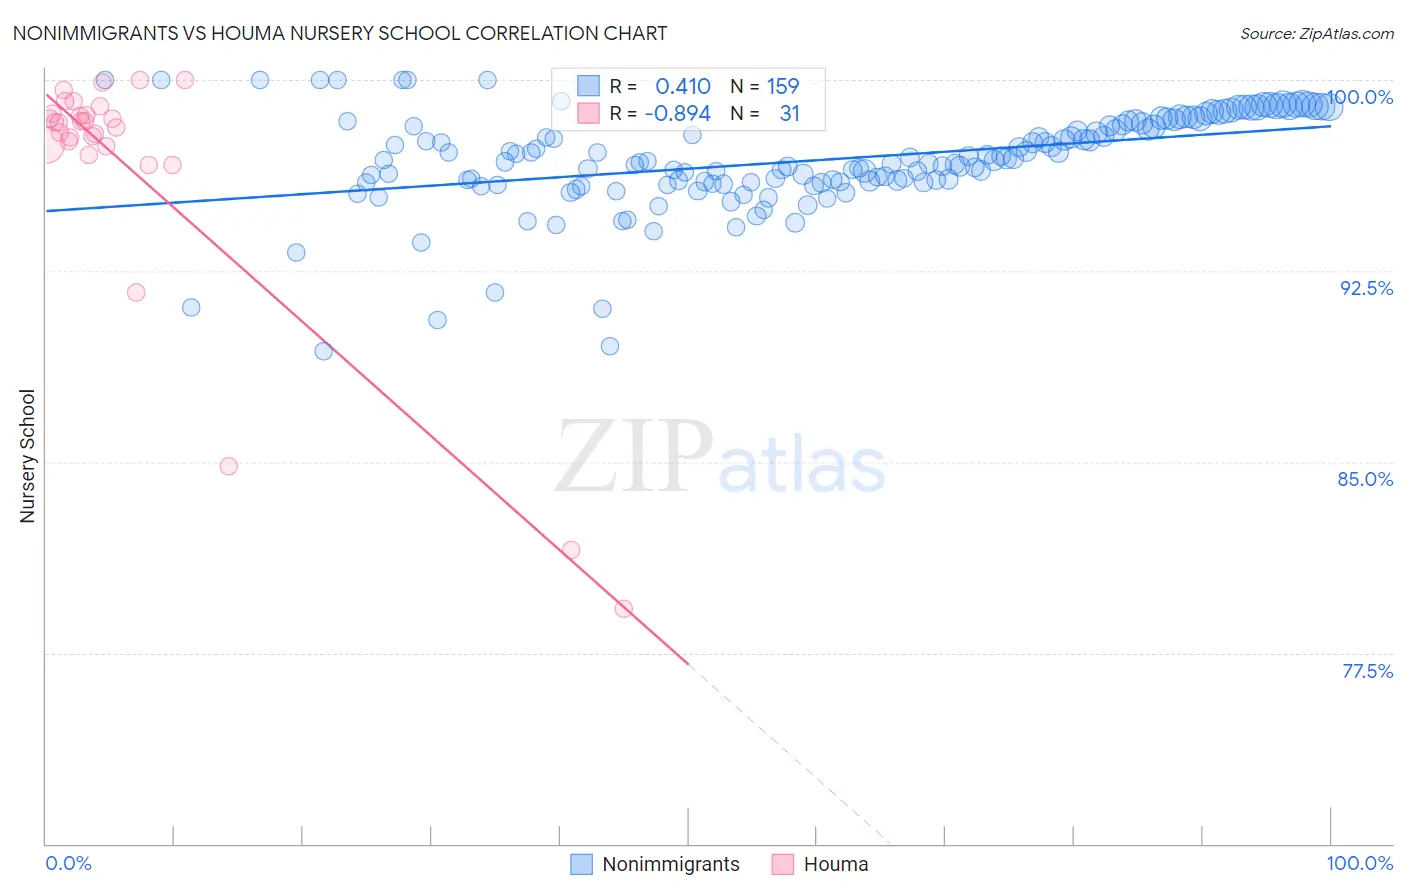
Nonimmigrants vs Houma Nursery School Correlation Chart
The statistical analysis conducted on geographies consisting of 585,374,774 people shows a moderate positive correlation between the proportion of Nonimmigrants and percentage of population with at least nursery school education in the United States with a correlation coefficient (R) of 0.410 and weighted average of 98.3%. Similarly, the statistical analysis conducted on geographies consisting of 36,795,916 people shows a very strong negative correlation between the proportion of Houma and percentage of population with at least nursery school education in the United States with a correlation coefficient (R) of -0.894 and weighted average of 97.3%, a difference of 1.0%.
Nursery School Correlation Summary
| Measurement | Nonimmigrants | Houma |
| Minimum | 89.3% | 79.2% |
| Maximum | 100.0% | 100.0% |
| Range | 10.7% | 20.8% |
| Mean | 96.8% | 96.5% |
| Median | 96.8% | 98.3% |
| Interquartile 25% (IQ1) | 96.0% | 97.4% |
| Interquartile 75% (IQ3) | 98.3% | 98.7% |
| Interquartile Range (IQR) | 2.3% | 1.3% |
| Standard Deviation (Sample) | 1.9% | 5.2% |
| Standard Deviation (Population) | 1.9% | 5.1% |
Similar Demographics by Nursery School
Demographics Similar to Nonimmigrants by Nursery School
In terms of nursery school, the demographic groups most similar to Nonimmigrants are Cypriot (98.3%, a difference of 0.0%), Choctaw (98.3%, a difference of 0.0%), Immigrants from Germany (98.3%, a difference of 0.010%), South African (98.3%, a difference of 0.010%), and Colville (98.3%, a difference of 0.010%).
| Demographics | Rating | Rank | Nursery School |
| Immigrants | Western Europe | 98.8 /100 | #90 | Exceptional 98.3% |
| Zimbabweans | 98.8 /100 | #91 | Exceptional 98.3% |
| Macedonians | 98.7 /100 | #92 | Exceptional 98.3% |
| Immigrants | India | 98.7 /100 | #93 | Exceptional 98.3% |
| Immigrants | Germany | 98.6 /100 | #94 | Exceptional 98.3% |
| South Africans | 98.6 /100 | #95 | Exceptional 98.3% |
| Cypriots | 98.3 /100 | #96 | Exceptional 98.3% |
| Immigrants | Nonimmigrants | 98.3 /100 | #97 | Exceptional 98.3% |
| Choctaw | 98.3 /100 | #98 | Exceptional 98.3% |
| Colville | 98.2 /100 | #99 | Exceptional 98.3% |
| Puget Sound Salish | 98.0 /100 | #100 | Exceptional 98.3% |
| Romanians | 97.9 /100 | #101 | Exceptional 98.3% |
| Immigrants | Ireland | 97.7 /100 | #102 | Exceptional 98.3% |
| Cree | 97.7 /100 | #103 | Exceptional 98.3% |
| Bhutanese | 97.4 /100 | #104 | Exceptional 98.2% |
Demographics Similar to Houma by Nursery School
In terms of nursery school, the demographic groups most similar to Houma are Malaysian (97.3%, a difference of 0.010%), British West Indian (97.3%, a difference of 0.020%), Immigrants from Grenada (97.3%, a difference of 0.020%), Immigrants (97.2%, a difference of 0.030%), and Immigrants from Eritrea (97.2%, a difference of 0.040%).
| Demographics | Rating | Rank | Nursery School |
| Immigrants | Barbados | 0.0 /100 | #285 | Tragic 97.4% |
| Immigrants | Portugal | 0.0 /100 | #286 | Tragic 97.4% |
| Immigrants | Hong Kong | 0.0 /100 | #287 | Tragic 97.4% |
| Immigrants | Thailand | 0.0 /100 | #288 | Tragic 97.3% |
| Immigrants | St. Vincent and the Grenadines | 0.0 /100 | #289 | Tragic 97.3% |
| Immigrants | Afghanistan | 0.0 /100 | #290 | Tragic 97.3% |
| British West Indians | 0.0 /100 | #291 | Tragic 97.3% |
| Houma | 0.0 /100 | #292 | Tragic 97.3% |
| Malaysians | 0.0 /100 | #293 | Tragic 97.3% |
| Immigrants | Grenada | 0.0 /100 | #294 | Tragic 97.3% |
| Immigrants | Immigrants | 0.0 /100 | #295 | Tragic 97.2% |
| Immigrants | Eritrea | 0.0 /100 | #296 | Tragic 97.2% |
| Immigrants | Cuba | 0.0 /100 | #297 | Tragic 97.2% |
| Central American Indians | 0.0 /100 | #298 | Tragic 97.2% |
| Immigrants | Dominica | 0.0 /100 | #299 | Tragic 97.2% |