Nonimmigrants vs Houma Associate's Degree
COMPARE
Nonimmigrants
Houma
Associate's Degree
Associate's Degree Comparison
Nonimmigrants
Houma
42.9%
ASSOCIATE'S DEGREE
1.9/ 100
METRIC RATING
237th/ 347
METRIC RANK
28.2%
ASSOCIATE'S DEGREE
0.0/ 100
METRIC RATING
346th/ 347
METRIC RANK
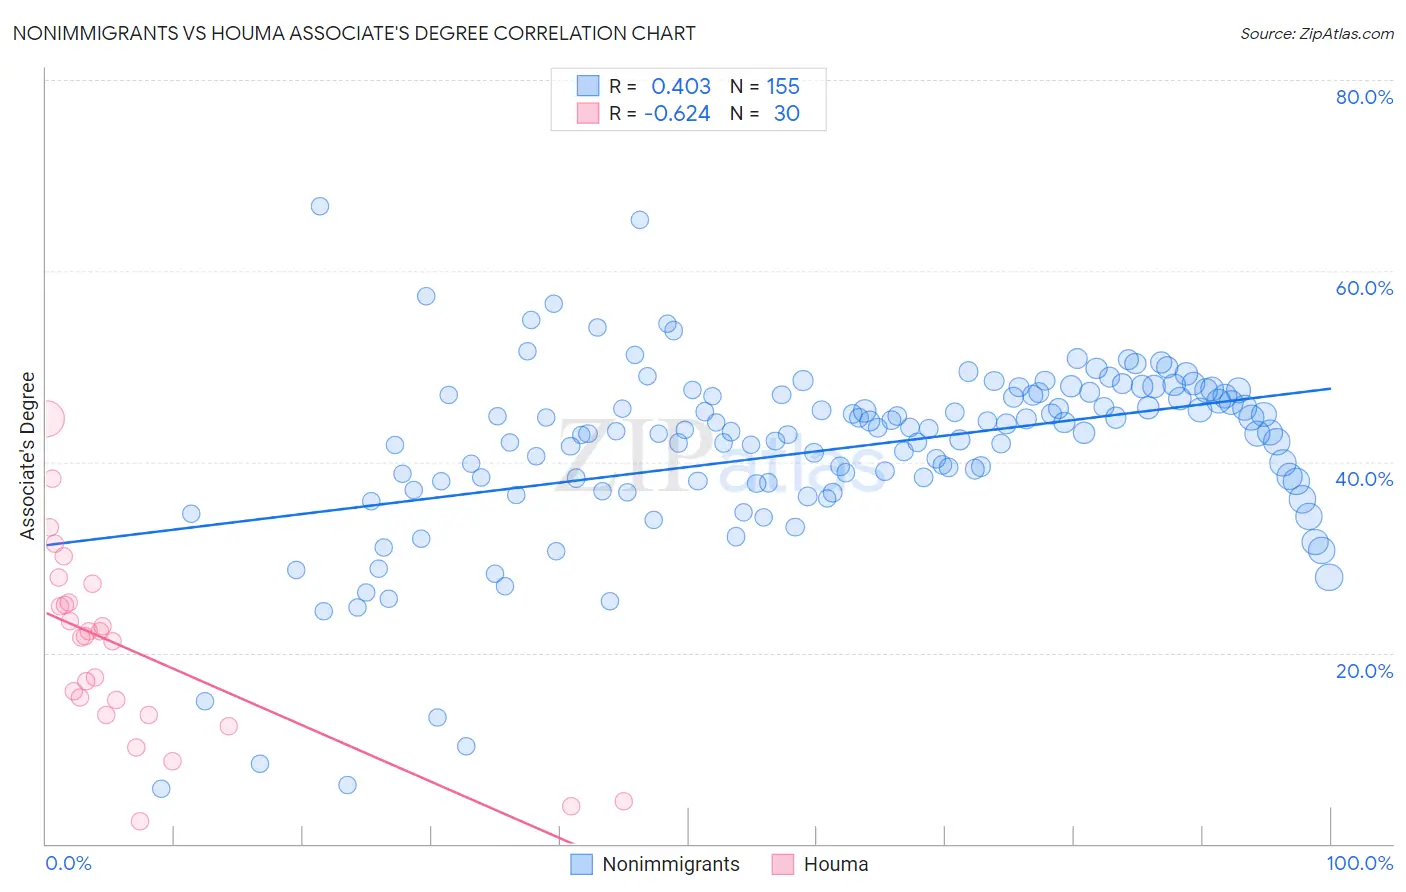
Nonimmigrants vs Houma Associate's Degree Correlation Chart
The statistical analysis conducted on geographies consisting of 585,078,225 people shows a moderate positive correlation between the proportion of Nonimmigrants and percentage of population with at least associate's degree education in the United States with a correlation coefficient (R) of 0.403 and weighted average of 42.9%. Similarly, the statistical analysis conducted on geographies consisting of 36,792,820 people shows a significant negative correlation between the proportion of Houma and percentage of population with at least associate's degree education in the United States with a correlation coefficient (R) of -0.624 and weighted average of 28.2%, a difference of 52.2%.
Associate's Degree Correlation Summary
| Measurement | Nonimmigrants | Houma |
| Minimum | 5.7% | 2.4% |
| Maximum | 66.8% | 44.5% |
| Range | 61.1% | 42.2% |
| Mean | 41.2% | 20.4% |
| Median | 43.1% | 21.7% |
| Interquartile 25% (IQ1) | 37.8% | 13.5% |
| Interquartile 75% (IQ3) | 47.0% | 25.3% |
| Interquartile Range (IQR) | 9.2% | 11.8% |
| Standard Deviation (Sample) | 9.6% | 9.9% |
| Standard Deviation (Population) | 9.6% | 9.7% |
Similar Demographics by Associate's Degree
Demographics Similar to Nonimmigrants by Associate's Degree
In terms of associate's degree, the demographic groups most similar to Nonimmigrants are Immigrants from St. Vincent and the Grenadines (42.9%, a difference of 0.020%), Ecuadorian (43.0%, a difference of 0.10%), Tlingit-Haida (43.0%, a difference of 0.20%), Iroquois (42.8%, a difference of 0.26%), and Tongan (43.0%, a difference of 0.29%).
| Demographics | Rating | Rank | Associate's Degree |
| Immigrants | Barbados | 2.9 /100 | #230 | Tragic 43.3% |
| Liberians | 2.9 /100 | #231 | Tragic 43.3% |
| Native Hawaiians | 2.3 /100 | #232 | Tragic 43.1% |
| Tongans | 2.2 /100 | #233 | Tragic 43.0% |
| Tlingit-Haida | 2.1 /100 | #234 | Tragic 43.0% |
| Ecuadorians | 2.0 /100 | #235 | Tragic 43.0% |
| Immigrants | St. Vincent and the Grenadines | 1.9 /100 | #236 | Tragic 42.9% |
| Immigrants | Nonimmigrants | 1.9 /100 | #237 | Tragic 42.9% |
| Iroquois | 1.7 /100 | #238 | Tragic 42.8% |
| Immigrants | Grenada | 1.3 /100 | #239 | Tragic 42.6% |
| Cree | 1.2 /100 | #240 | Tragic 42.5% |
| British West Indians | 1.0 /100 | #241 | Tragic 42.4% |
| Immigrants | West Indies | 1.0 /100 | #242 | Tragic 42.4% |
| Guyanese | 1.0 /100 | #243 | Tragic 42.3% |
| Immigrants | Liberia | 0.9 /100 | #244 | Tragic 42.3% |
Demographics Similar to Houma by Associate's Degree
In terms of associate's degree, the demographic groups most similar to Houma are Pima (30.2%, a difference of 7.2%), Yuman (31.3%, a difference of 10.8%), Tohono O'odham (31.8%, a difference of 12.7%), Yup'ik (25.0%, a difference of 13.0%), and Yakama (32.3%, a difference of 14.6%).
| Demographics | Rating | Rank | Associate's Degree |
| Mexicans | 0.0 /100 | #333 | Tragic 35.0% |
| Natives/Alaskans | 0.0 /100 | #334 | Tragic 34.9% |
| Spanish American Indians | 0.0 /100 | #335 | Tragic 34.9% |
| Hopi | 0.0 /100 | #336 | Tragic 34.6% |
| Lumbee | 0.0 /100 | #337 | Tragic 34.1% |
| Pueblo | 0.0 /100 | #338 | Tragic 34.0% |
| Immigrants | Mexico | 0.0 /100 | #339 | Tragic 33.7% |
| Navajo | 0.0 /100 | #340 | Tragic 32.6% |
| Inupiat | 0.0 /100 | #341 | Tragic 32.6% |
| Yakama | 0.0 /100 | #342 | Tragic 32.3% |
| Tohono O'odham | 0.0 /100 | #343 | Tragic 31.8% |
| Yuman | 0.0 /100 | #344 | Tragic 31.3% |
| Pima | 0.0 /100 | #345 | Tragic 30.2% |
| Houma | 0.0 /100 | #346 | Tragic 28.2% |
| Yup'ik | 0.0 /100 | #347 | Tragic 25.0% |