New Zealander vs Immigrants from Vietnam Vision Disability
COMPARE
New Zealander
Immigrants from Vietnam
Vision Disability
Vision Disability Comparison
New Zealanders
Immigrants from Vietnam
2.1%
VISION DISABILITY
88.2/ 100
METRIC RATING
132nd/ 347
METRIC RANK
2.1%
VISION DISABILITY
92.2/ 100
METRIC RATING
115th/ 347
METRIC RANK
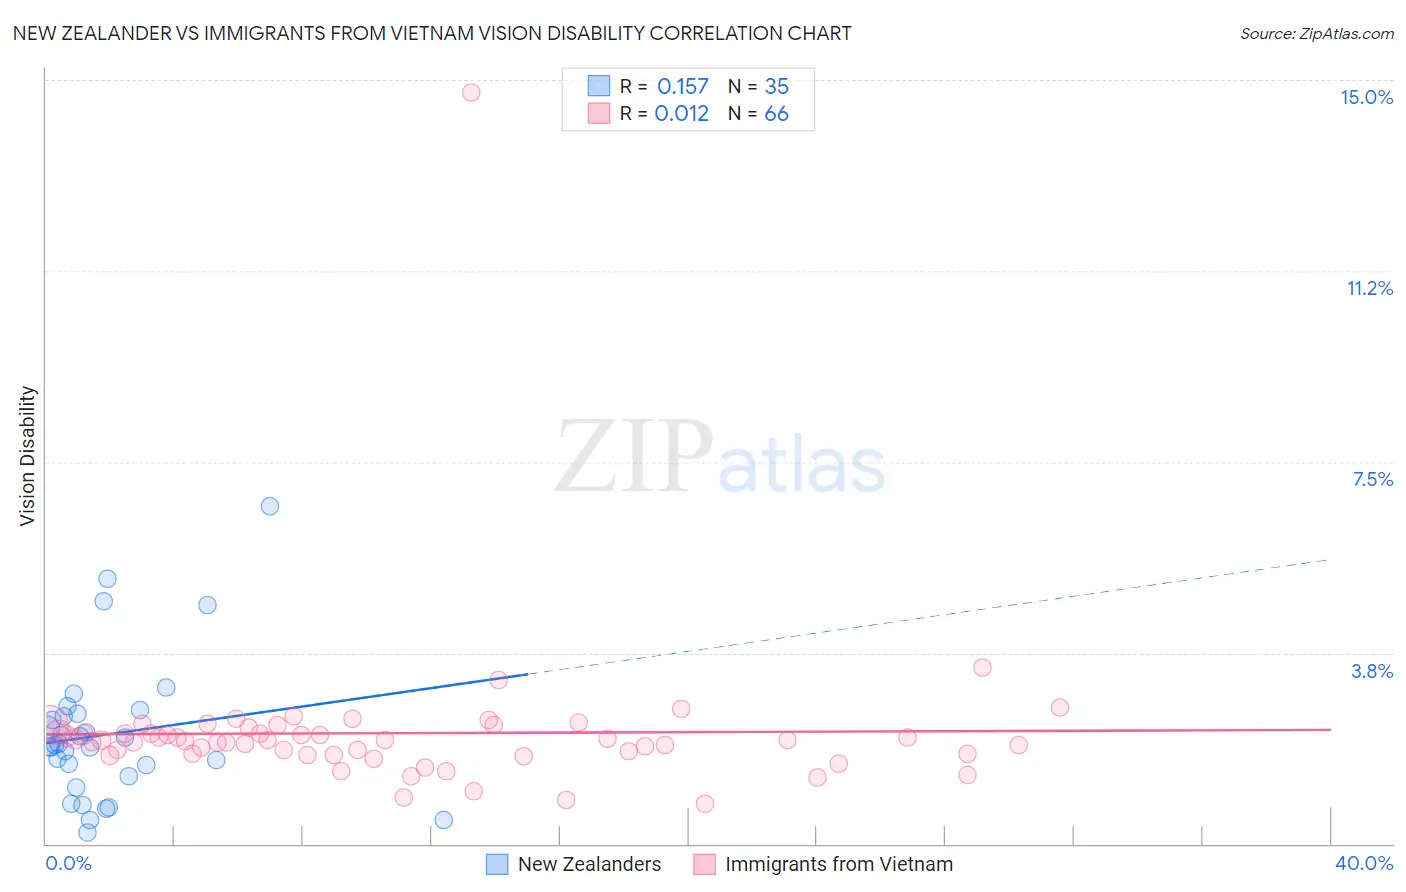
New Zealander vs Immigrants from Vietnam Vision Disability Correlation Chart
The statistical analysis conducted on geographies consisting of 106,891,715 people shows a poor positive correlation between the proportion of New Zealanders and percentage of population with vision disability in the United States with a correlation coefficient (R) of 0.157 and weighted average of 2.1%. Similarly, the statistical analysis conducted on geographies consisting of 404,576,712 people shows no correlation between the proportion of Immigrants from Vietnam and percentage of population with vision disability in the United States with a correlation coefficient (R) of 0.012 and weighted average of 2.1%, a difference of 0.76%.
Vision Disability Correlation Summary
| Measurement | New Zealander | Immigrants from Vietnam |
| Minimum | 0.22% | 0.78% |
| Maximum | 6.6% | 14.7% |
| Range | 6.4% | 14.0% |
| Mean | 2.2% | 2.2% |
| Median | 1.9% | 2.0% |
| Interquartile 25% (IQ1) | 1.3% | 1.8% |
| Interquartile 75% (IQ3) | 2.5% | 2.2% |
| Interquartile Range (IQR) | 1.2% | 0.43% |
| Standard Deviation (Sample) | 1.4% | 1.6% |
| Standard Deviation (Population) | 1.4% | 1.6% |
Demographics Similar to New Zealanders and Immigrants from Vietnam by Vision Disability
In terms of vision disability, the demographic groups most similar to New Zealanders are Immigrants from Hungary (2.1%, a difference of 0.080%), Immigrants from Kenya (2.1%, a difference of 0.090%), Immigrants from Cameroon (2.1%, a difference of 0.10%), Syrian (2.1%, a difference of 0.10%), and Immigrants from Chile (2.1%, a difference of 0.13%). Similarly, the demographic groups most similar to Immigrants from Vietnam are Ugandan (2.1%, a difference of 0.0%), Croatian (2.1%, a difference of 0.020%), Polish (2.1%, a difference of 0.050%), Kenyan (2.1%, a difference of 0.060%), and Immigrants from Philippines (2.1%, a difference of 0.18%).
| Demographics | Rating | Rank | Vision Disability |
| Kenyans | 92.5 /100 | #113 | Exceptional 2.1% |
| Croatians | 92.3 /100 | #114 | Exceptional 2.1% |
| Immigrants | Vietnam | 92.2 /100 | #115 | Exceptional 2.1% |
| Ugandans | 92.2 /100 | #116 | Exceptional 2.1% |
| Poles | 92.0 /100 | #117 | Exceptional 2.1% |
| Immigrants | Philippines | 91.4 /100 | #118 | Exceptional 2.1% |
| Immigrants | Uganda | 91.4 /100 | #119 | Exceptional 2.1% |
| Immigrants | Zimbabwe | 91.0 /100 | #120 | Exceptional 2.1% |
| Immigrants | Scotland | 90.4 /100 | #121 | Exceptional 2.1% |
| Immigrants | Ukraine | 90.4 /100 | #122 | Exceptional 2.1% |
| Immigrants | Albania | 90.4 /100 | #123 | Exceptional 2.1% |
| Immigrants | Spain | 89.8 /100 | #124 | Excellent 2.1% |
| Immigrants | Venezuela | 89.8 /100 | #125 | Excellent 2.1% |
| Immigrants | Peru | 89.5 /100 | #126 | Excellent 2.1% |
| Sudanese | 89.2 /100 | #127 | Excellent 2.1% |
| Immigrants | Chile | 89.0 /100 | #128 | Excellent 2.1% |
| Immigrants | Cameroon | 88.8 /100 | #129 | Excellent 2.1% |
| Immigrants | Kenya | 88.7 /100 | #130 | Excellent 2.1% |
| Immigrants | Hungary | 88.7 /100 | #131 | Excellent 2.1% |
| New Zealanders | 88.2 /100 | #132 | Excellent 2.1% |
| Syrians | 87.5 /100 | #133 | Excellent 2.1% |