Navajo vs Immigrants from Albania 10th Grade
COMPARE
Navajo
Immigrants from Albania
10th Grade
10th Grade Comparison
Navajo
Immigrants from Albania
92.3%
10TH GRADE
0.1/ 100
METRIC RATING
277th/ 347
METRIC RANK
93.8%
10TH GRADE
52.4/ 100
METRIC RATING
171st/ 347
METRIC RANK
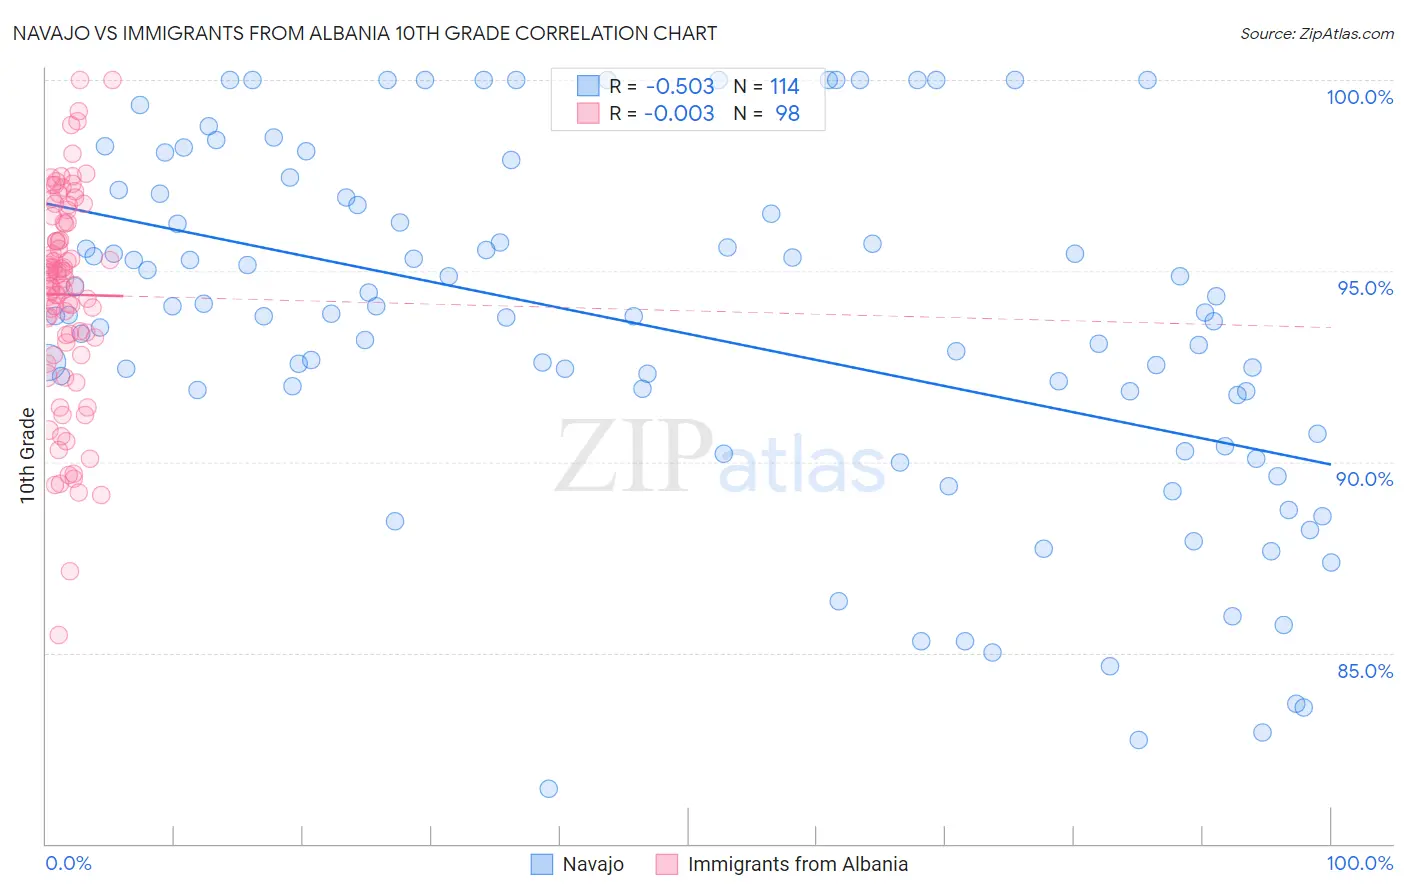
Navajo vs Immigrants from Albania 10th Grade Correlation Chart
The statistical analysis conducted on geographies consisting of 224,872,587 people shows a substantial negative correlation between the proportion of Navajo and percentage of population with at least 10th grade education in the United States with a correlation coefficient (R) of -0.503 and weighted average of 92.3%. Similarly, the statistical analysis conducted on geographies consisting of 119,309,649 people shows no correlation between the proportion of Immigrants from Albania and percentage of population with at least 10th grade education in the United States with a correlation coefficient (R) of -0.003 and weighted average of 93.8%, a difference of 1.6%.
10th Grade Correlation Summary
| Measurement | Navajo | Immigrants from Albania |
| Minimum | 81.4% | 85.5% |
| Maximum | 100.0% | 100.0% |
| Range | 18.6% | 14.5% |
| Mean | 93.5% | 94.4% |
| Median | 93.8% | 94.8% |
| Interquartile 25% (IQ1) | 90.7% | 93.1% |
| Interquartile 75% (IQ3) | 96.7% | 96.3% |
| Interquartile Range (IQR) | 6.0% | 3.1% |
| Standard Deviation (Sample) | 4.6% | 2.8% |
| Standard Deviation (Population) | 4.6% | 2.8% |
Similar Demographics by 10th Grade
Demographics Similar to Navajo by 10th Grade
In terms of 10th grade, the demographic groups most similar to Navajo are Barbadian (92.2%, a difference of 0.040%), Native/Alaskan (92.2%, a difference of 0.040%), Immigrants from Trinidad and Tobago (92.3%, a difference of 0.070%), Malaysian (92.2%, a difference of 0.070%), and Bangladeshi (92.2%, a difference of 0.080%).
| Demographics | Rating | Rank | 10th Grade |
| Immigrants | Uruguay | 0.3 /100 | #270 | Tragic 92.5% |
| Immigrants | Eritrea | 0.3 /100 | #271 | Tragic 92.5% |
| Immigrants | Western Africa | 0.3 /100 | #272 | Tragic 92.5% |
| Trinidadians and Tobagonians | 0.2 /100 | #273 | Tragic 92.4% |
| Immigrants | Congo | 0.2 /100 | #274 | Tragic 92.4% |
| West Indians | 0.2 /100 | #275 | Tragic 92.4% |
| Immigrants | Trinidad and Tobago | 0.1 /100 | #276 | Tragic 92.3% |
| Navajo | 0.1 /100 | #277 | Tragic 92.3% |
| Barbadians | 0.1 /100 | #278 | Tragic 92.2% |
| Natives/Alaskans | 0.1 /100 | #279 | Tragic 92.2% |
| Malaysians | 0.1 /100 | #280 | Tragic 92.2% |
| Bangladeshis | 0.1 /100 | #281 | Tragic 92.2% |
| Immigrants | Peru | 0.1 /100 | #282 | Tragic 92.2% |
| Immigrants | St. Vincent and the Grenadines | 0.0 /100 | #283 | Tragic 92.1% |
| Immigrants | Barbados | 0.0 /100 | #284 | Tragic 92.1% |
Demographics Similar to Immigrants from Albania by 10th Grade
In terms of 10th grade, the demographic groups most similar to Immigrants from Albania are Immigrants from Venezuela (93.8%, a difference of 0.010%), French American Indian (93.7%, a difference of 0.010%), Spaniard (93.7%, a difference of 0.020%), Argentinean (93.7%, a difference of 0.020%), and Immigrants from Nepal (93.7%, a difference of 0.020%).
| Demographics | Rating | Rank | 10th Grade |
| Iraqis | 68.1 /100 | #164 | Good 93.9% |
| Brazilians | 63.6 /100 | #165 | Good 93.8% |
| Immigrants | Iraq | 63.0 /100 | #166 | Good 93.8% |
| Immigrants | Egypt | 62.3 /100 | #167 | Good 93.8% |
| Alsatians | 59.4 /100 | #168 | Average 93.8% |
| Immigrants | Spain | 55.9 /100 | #169 | Average 93.8% |
| Immigrants | Venezuela | 53.9 /100 | #170 | Average 93.8% |
| Immigrants | Albania | 52.4 /100 | #171 | Average 93.8% |
| French American Indians | 50.9 /100 | #172 | Average 93.7% |
| Spaniards | 50.3 /100 | #173 | Average 93.7% |
| Argentineans | 50.0 /100 | #174 | Average 93.7% |
| Immigrants | Nepal | 49.6 /100 | #175 | Average 93.7% |
| Immigrants | Argentina | 47.1 /100 | #176 | Average 93.7% |
| Immigrants | Lebanon | 47.1 /100 | #177 | Average 93.7% |
| Sierra Leoneans | 46.1 /100 | #178 | Average 93.7% |