Navajo vs Marshallese 10th Grade
COMPARE
Navajo
Marshallese
10th Grade
10th Grade Comparison
Navajo
Marshallese
92.3%
10TH GRADE
0.1/ 100
METRIC RATING
277th/ 347
METRIC RANK
93.6%
10TH GRADE
33.2/ 100
METRIC RATING
188th/ 347
METRIC RANK
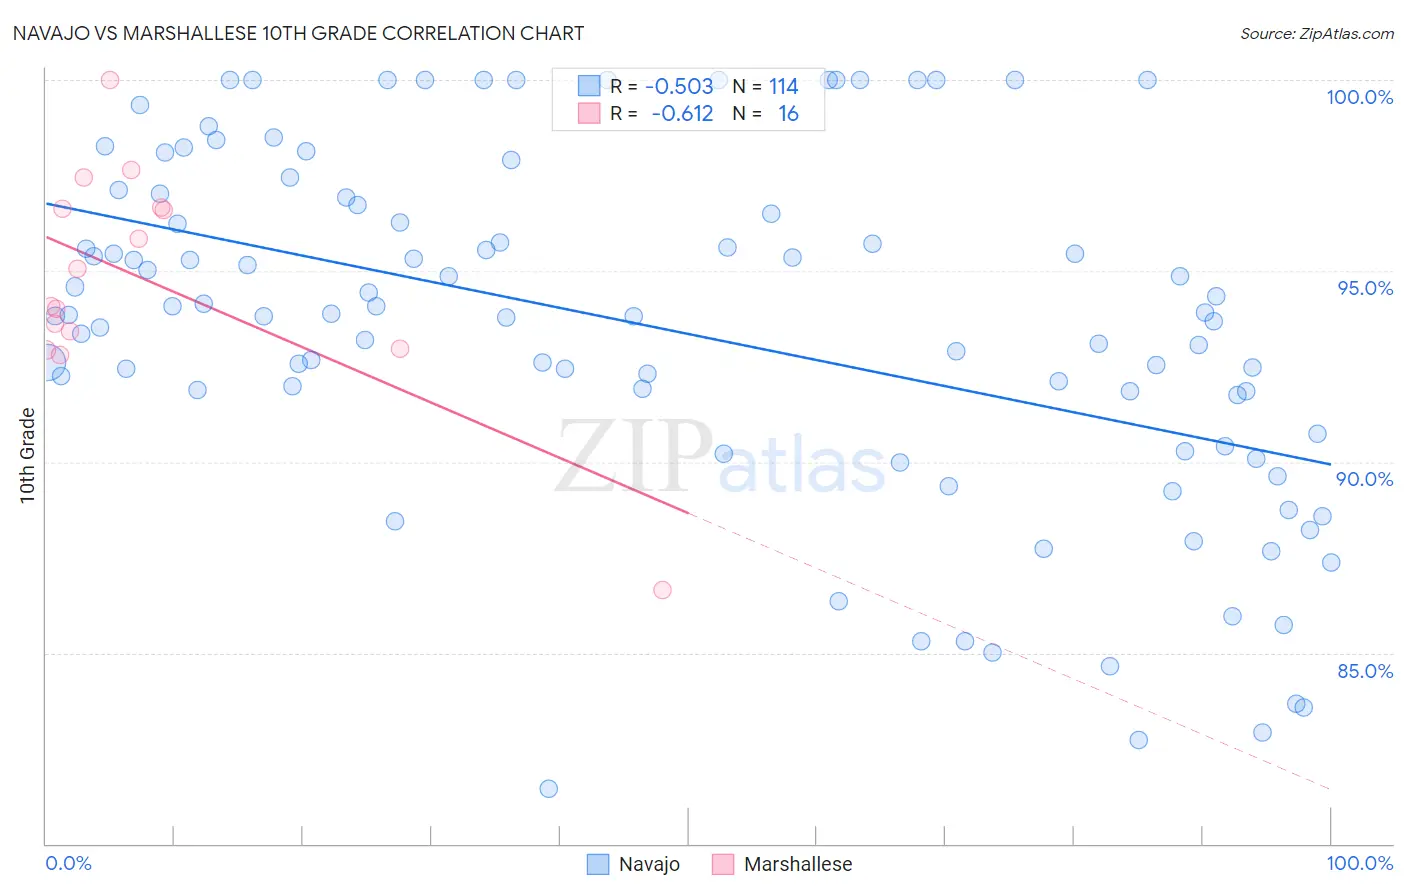
Navajo vs Marshallese 10th Grade Correlation Chart
The statistical analysis conducted on geographies consisting of 224,872,587 people shows a substantial negative correlation between the proportion of Navajo and percentage of population with at least 10th grade education in the United States with a correlation coefficient (R) of -0.503 and weighted average of 92.3%. Similarly, the statistical analysis conducted on geographies consisting of 14,761,315 people shows a significant negative correlation between the proportion of Marshallese and percentage of population with at least 10th grade education in the United States with a correlation coefficient (R) of -0.612 and weighted average of 93.6%, a difference of 1.5%.
10th Grade Correlation Summary
| Measurement | Navajo | Marshallese |
| Minimum | 81.4% | 86.6% |
| Maximum | 100.0% | 100.0% |
| Range | 18.6% | 13.4% |
| Mean | 93.5% | 94.8% |
| Median | 93.8% | 94.6% |
| Interquartile 25% (IQ1) | 90.7% | 93.2% |
| Interquartile 75% (IQ3) | 96.7% | 96.6% |
| Interquartile Range (IQR) | 6.0% | 3.4% |
| Standard Deviation (Sample) | 4.6% | 3.0% |
| Standard Deviation (Population) | 4.6% | 2.9% |
Similar Demographics by 10th Grade
Demographics Similar to Navajo by 10th Grade
In terms of 10th grade, the demographic groups most similar to Navajo are Barbadian (92.2%, a difference of 0.040%), Native/Alaskan (92.2%, a difference of 0.040%), Immigrants from Trinidad and Tobago (92.3%, a difference of 0.070%), Malaysian (92.2%, a difference of 0.070%), and Bangladeshi (92.2%, a difference of 0.080%).
| Demographics | Rating | Rank | 10th Grade |
| Immigrants | Uruguay | 0.3 /100 | #270 | Tragic 92.5% |
| Immigrants | Eritrea | 0.3 /100 | #271 | Tragic 92.5% |
| Immigrants | Western Africa | 0.3 /100 | #272 | Tragic 92.5% |
| Trinidadians and Tobagonians | 0.2 /100 | #273 | Tragic 92.4% |
| Immigrants | Congo | 0.2 /100 | #274 | Tragic 92.4% |
| West Indians | 0.2 /100 | #275 | Tragic 92.4% |
| Immigrants | Trinidad and Tobago | 0.1 /100 | #276 | Tragic 92.3% |
| Navajo | 0.1 /100 | #277 | Tragic 92.3% |
| Barbadians | 0.1 /100 | #278 | Tragic 92.2% |
| Natives/Alaskans | 0.1 /100 | #279 | Tragic 92.2% |
| Malaysians | 0.1 /100 | #280 | Tragic 92.2% |
| Bangladeshis | 0.1 /100 | #281 | Tragic 92.2% |
| Immigrants | Peru | 0.1 /100 | #282 | Tragic 92.2% |
| Immigrants | St. Vincent and the Grenadines | 0.0 /100 | #283 | Tragic 92.1% |
| Immigrants | Barbados | 0.0 /100 | #284 | Tragic 92.1% |
Demographics Similar to Marshallese by 10th Grade
In terms of 10th grade, the demographic groups most similar to Marshallese are Immigrants from Pakistan (93.6%, a difference of 0.010%), Laotian (93.6%, a difference of 0.010%), Immigrants from Eastern Asia (93.6%, a difference of 0.020%), Liberian (93.6%, a difference of 0.020%), and Yup'ik (93.6%, a difference of 0.020%).
| Demographics | Rating | Rank | 10th Grade |
| Immigrants | Northern Africa | 41.6 /100 | #181 | Average 93.7% |
| Colville | 38.8 /100 | #182 | Fair 93.6% |
| Guamanians/Chamorros | 37.1 /100 | #183 | Fair 93.6% |
| Choctaw | 36.6 /100 | #184 | Fair 93.6% |
| Sudanese | 36.6 /100 | #185 | Fair 93.6% |
| Immigrants | Eastern Asia | 35.1 /100 | #186 | Fair 93.6% |
| Liberians | 34.7 /100 | #187 | Fair 93.6% |
| Marshallese | 33.2 /100 | #188 | Fair 93.6% |
| Immigrants | Pakistan | 32.5 /100 | #189 | Fair 93.6% |
| Laotians | 32.1 /100 | #190 | Fair 93.6% |
| Yup'ik | 31.1 /100 | #191 | Fair 93.6% |
| Immigrants | Malaysia | 28.0 /100 | #192 | Fair 93.5% |
| Panamanians | 28.0 /100 | #193 | Fair 93.5% |
| Immigrants | Morocco | 26.9 /100 | #194 | Fair 93.5% |
| Cheyenne | 26.8 /100 | #195 | Fair 93.5% |