Indian (Asian) vs Immigrants from Ecuador Professional Degree
COMPARE
Indian (Asian)
Immigrants from Ecuador
Professional Degree
Professional Degree Comparison
Indians (Asian)
Immigrants from Ecuador
6.5%
PROFESSIONAL DEGREE
100.0/ 100
METRIC RATING
19th/ 347
METRIC RANK
3.8%
PROFESSIONAL DEGREE
2.3/ 100
METRIC RATING
240th/ 347
METRIC RANK
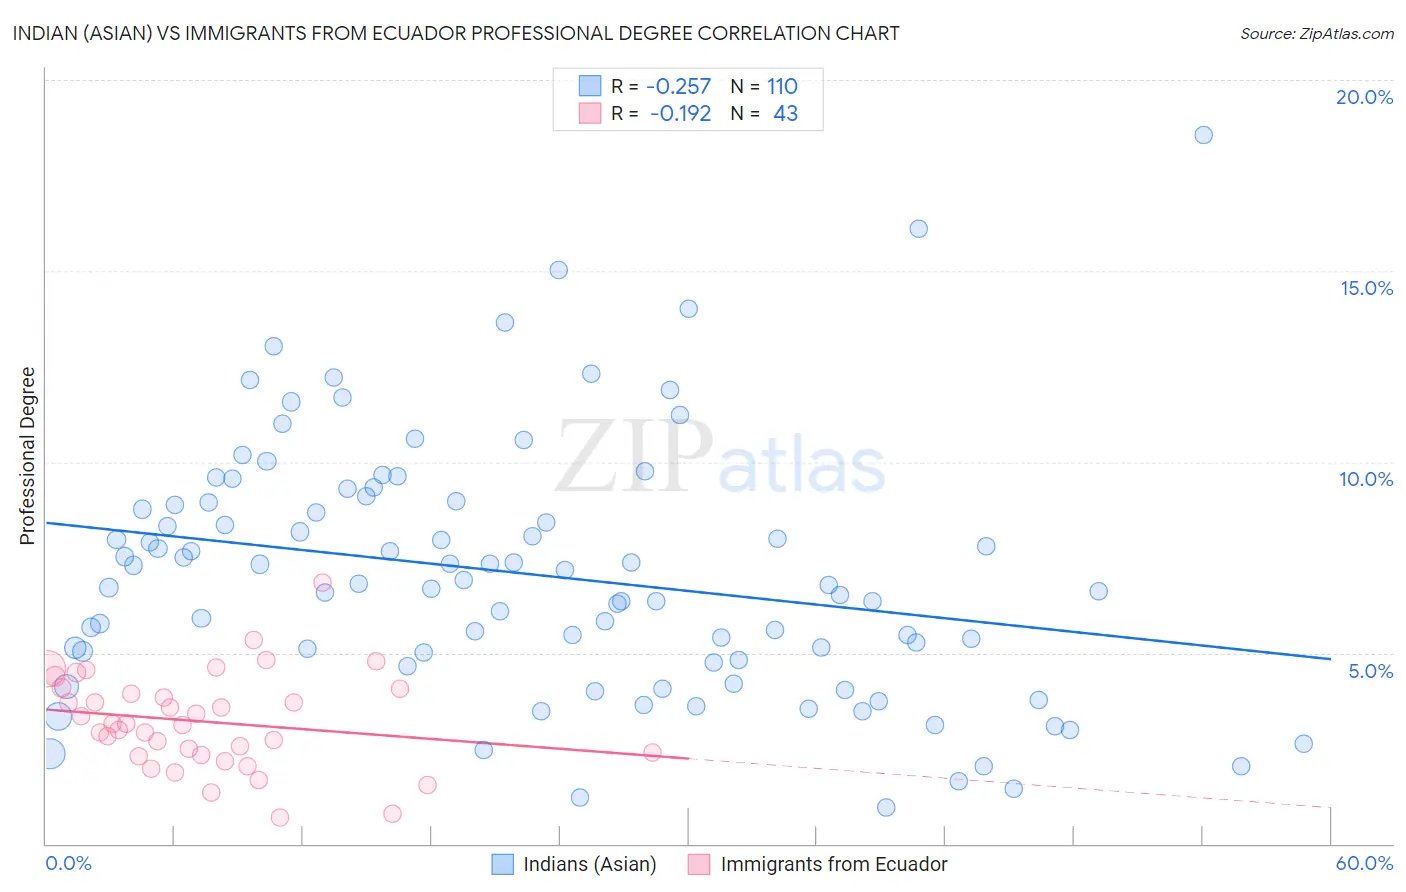
Indian (Asian) vs Immigrants from Ecuador Professional Degree Correlation Chart
The statistical analysis conducted on geographies consisting of 493,505,427 people shows a weak negative correlation between the proportion of Indians (Asian) and percentage of population with at least professional degree education in the United States with a correlation coefficient (R) of -0.257 and weighted average of 6.5%. Similarly, the statistical analysis conducted on geographies consisting of 270,711,574 people shows a poor negative correlation between the proportion of Immigrants from Ecuador and percentage of population with at least professional degree education in the United States with a correlation coefficient (R) of -0.192 and weighted average of 3.8%, a difference of 71.4%.
Professional Degree Correlation Summary
| Measurement | Indian (Asian) | Immigrants from Ecuador |
| Minimum | 0.96% | 0.70% |
| Maximum | 18.6% | 6.9% |
| Range | 17.6% | 6.2% |
| Mean | 7.1% | 3.2% |
| Median | 6.8% | 3.1% |
| Interquartile 25% (IQ1) | 4.8% | 2.3% |
| Interquartile 75% (IQ3) | 8.9% | 4.1% |
| Interquartile Range (IQR) | 4.1% | 1.7% |
| Standard Deviation (Sample) | 3.3% | 1.3% |
| Standard Deviation (Population) | 3.3% | 1.2% |
Similar Demographics by Professional Degree
Demographics Similar to Indians (Asian) by Professional Degree
In terms of professional degree, the demographic groups most similar to Indians (Asian) are Soviet Union (6.6%, a difference of 0.66%), Immigrants from Eastern Asia (6.6%, a difference of 0.68%), Immigrants from Denmark (6.4%, a difference of 1.5%), Immigrants from Hong Kong (6.4%, a difference of 1.8%), and Immigrants from Japan (6.4%, a difference of 2.5%).
| Demographics | Rating | Rank | Professional Degree |
| Israelis | 100.0 /100 | #12 | Exceptional 6.9% |
| Immigrants | Australia | 100.0 /100 | #13 | Exceptional 6.9% |
| Immigrants | France | 100.0 /100 | #14 | Exceptional 6.8% |
| Immigrants | China | 100.0 /100 | #15 | Exceptional 6.7% |
| Immigrants | Sweden | 100.0 /100 | #16 | Exceptional 6.7% |
| Immigrants | Eastern Asia | 100.0 /100 | #17 | Exceptional 6.6% |
| Soviet Union | 100.0 /100 | #18 | Exceptional 6.6% |
| Indians (Asian) | 100.0 /100 | #19 | Exceptional 6.5% |
| Immigrants | Denmark | 100.0 /100 | #20 | Exceptional 6.4% |
| Immigrants | Hong Kong | 100.0 /100 | #21 | Exceptional 6.4% |
| Immigrants | Japan | 100.0 /100 | #22 | Exceptional 6.4% |
| Russians | 100.0 /100 | #23 | Exceptional 6.3% |
| Immigrants | Spain | 100.0 /100 | #24 | Exceptional 6.3% |
| Immigrants | Ireland | 100.0 /100 | #25 | Exceptional 6.3% |
| Latvians | 100.0 /100 | #26 | Exceptional 6.2% |
Demographics Similar to Immigrants from Ecuador by Professional Degree
In terms of professional degree, the demographic groups most similar to Immigrants from Ecuador are Alaskan Athabascan (3.8%, a difference of 0.020%), Native Hawaiian (3.8%, a difference of 0.020%), Guamanian/Chamorro (3.8%, a difference of 0.10%), British West Indian (3.8%, a difference of 0.23%), and Immigrants from Bahamas (3.8%, a difference of 0.53%).
| Demographics | Rating | Rank | Professional Degree |
| Immigrants | Philippines | 4.1 /100 | #233 | Tragic 3.9% |
| Immigrants | Nonimmigrants | 4.0 /100 | #234 | Tragic 3.9% |
| Immigrants | Barbados | 4.0 /100 | #235 | Tragic 3.9% |
| Spanish Americans | 3.8 /100 | #236 | Tragic 3.9% |
| Immigrants | Trinidad and Tobago | 3.8 /100 | #237 | Tragic 3.9% |
| Colville | 2.6 /100 | #238 | Tragic 3.8% |
| British West Indians | 2.4 /100 | #239 | Tragic 3.8% |
| Immigrants | Ecuador | 2.3 /100 | #240 | Tragic 3.8% |
| Alaskan Athabascans | 2.3 /100 | #241 | Tragic 3.8% |
| Native Hawaiians | 2.3 /100 | #242 | Tragic 3.8% |
| Guamanians/Chamorros | 2.2 /100 | #243 | Tragic 3.8% |
| Immigrants | Bahamas | 2.0 /100 | #244 | Tragic 3.8% |
| French American Indians | 1.7 /100 | #245 | Tragic 3.8% |
| Marshallese | 1.7 /100 | #246 | Tragic 3.8% |
| Guyanese | 1.6 /100 | #247 | Tragic 3.8% |