Indonesian vs Immigrants from Ecuador Professional Degree
COMPARE
Indonesian
Immigrants from Ecuador
Professional Degree
Professional Degree Comparison
Indonesians
Immigrants from Ecuador
3.7%
PROFESSIONAL DEGREE
1.0/ 100
METRIC RATING
260th/ 347
METRIC RANK
3.8%
PROFESSIONAL DEGREE
2.3/ 100
METRIC RATING
240th/ 347
METRIC RANK
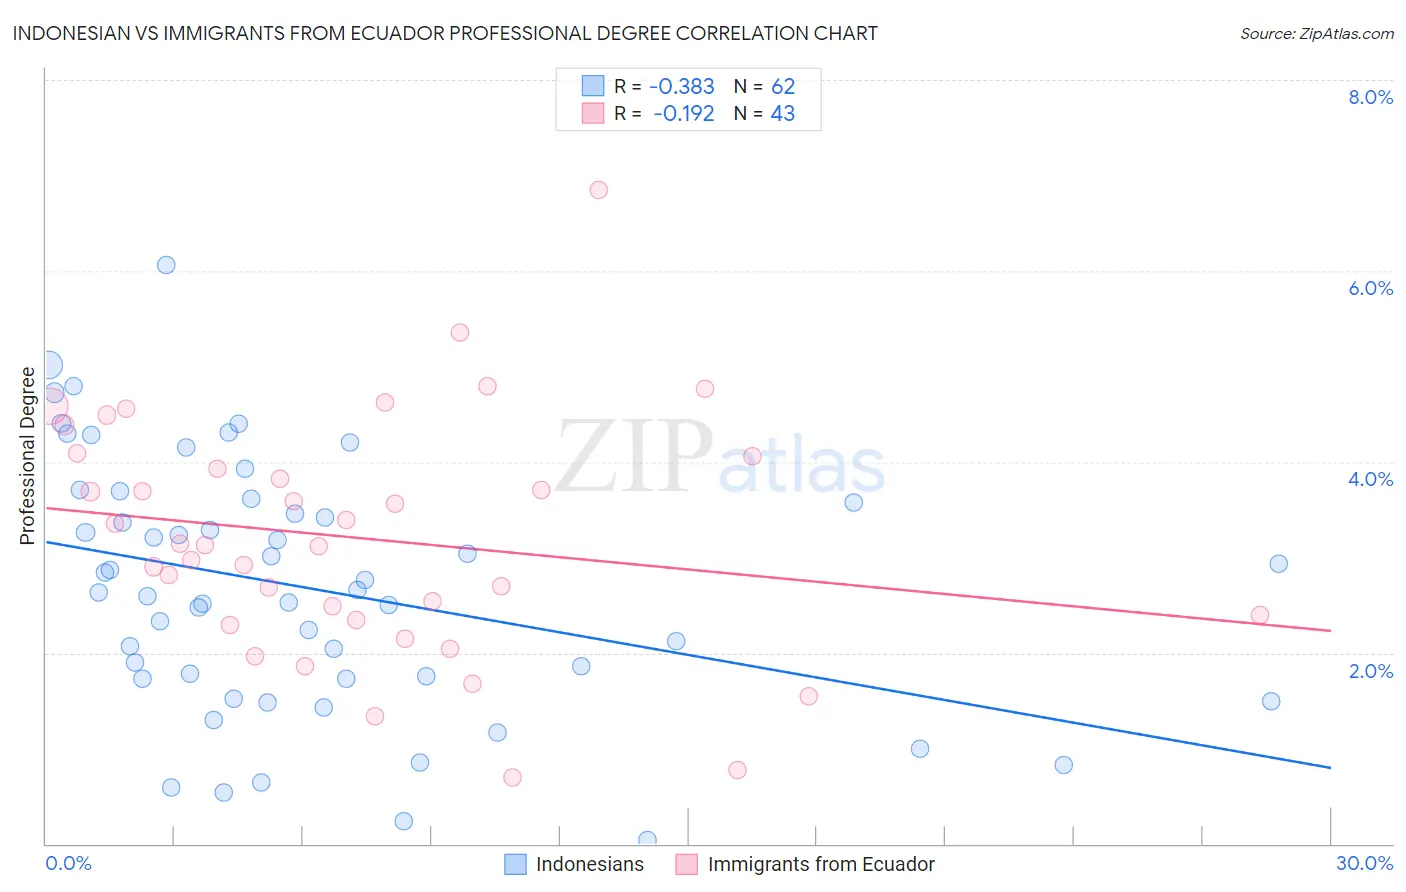
Indonesian vs Immigrants from Ecuador Professional Degree Correlation Chart
The statistical analysis conducted on geographies consisting of 162,566,642 people shows a mild negative correlation between the proportion of Indonesians and percentage of population with at least professional degree education in the United States with a correlation coefficient (R) of -0.383 and weighted average of 3.7%. Similarly, the statistical analysis conducted on geographies consisting of 270,711,574 people shows a poor negative correlation between the proportion of Immigrants from Ecuador and percentage of population with at least professional degree education in the United States with a correlation coefficient (R) of -0.192 and weighted average of 3.8%, a difference of 3.7%.
Professional Degree Correlation Summary
| Measurement | Indonesian | Immigrants from Ecuador |
| Minimum | 0.034% | 0.70% |
| Maximum | 6.1% | 6.9% |
| Range | 6.0% | 6.2% |
| Mean | 2.7% | 3.2% |
| Median | 2.6% | 3.1% |
| Interquartile 25% (IQ1) | 1.7% | 2.3% |
| Interquartile 75% (IQ3) | 3.6% | 4.1% |
| Interquartile Range (IQR) | 1.8% | 1.7% |
| Standard Deviation (Sample) | 1.3% | 1.3% |
| Standard Deviation (Population) | 1.3% | 1.2% |
Demographics Similar to Indonesians and Immigrants from Ecuador by Professional Degree
In terms of professional degree, the demographic groups most similar to Indonesians are African (3.7%, a difference of 0.010%), Immigrants from St. Vincent and the Grenadines (3.7%, a difference of 0.23%), Bahamian (3.7%, a difference of 0.31%), Iroquois (3.7%, a difference of 0.68%), and Osage (3.7%, a difference of 0.78%). Similarly, the demographic groups most similar to Immigrants from Ecuador are Alaskan Athabascan (3.8%, a difference of 0.020%), Native Hawaiian (3.8%, a difference of 0.020%), Guamanian/Chamorro (3.8%, a difference of 0.10%), Immigrants from Bahamas (3.8%, a difference of 0.53%), and French American Indian (3.8%, a difference of 1.2%).
| Demographics | Rating | Rank | Professional Degree |
| Immigrants | Ecuador | 2.3 /100 | #240 | Tragic 3.8% |
| Alaskan Athabascans | 2.3 /100 | #241 | Tragic 3.8% |
| Native Hawaiians | 2.3 /100 | #242 | Tragic 3.8% |
| Guamanians/Chamorros | 2.2 /100 | #243 | Tragic 3.8% |
| Immigrants | Bahamas | 2.0 /100 | #244 | Tragic 3.8% |
| French American Indians | 1.7 /100 | #245 | Tragic 3.8% |
| Marshallese | 1.7 /100 | #246 | Tragic 3.8% |
| Guyanese | 1.6 /100 | #247 | Tragic 3.8% |
| Hmong | 1.6 /100 | #248 | Tragic 3.7% |
| Immigrants | Grenada | 1.5 /100 | #249 | Tragic 3.7% |
| Immigrants | Fiji | 1.5 /100 | #250 | Tragic 3.7% |
| Immigrants | Nicaragua | 1.4 /100 | #251 | Tragic 3.7% |
| Jamaicans | 1.4 /100 | #252 | Tragic 3.7% |
| Pueblo | 1.4 /100 | #253 | Tragic 3.7% |
| Tongans | 1.3 /100 | #254 | Tragic 3.7% |
| Osage | 1.2 /100 | #255 | Tragic 3.7% |
| Iroquois | 1.2 /100 | #256 | Tragic 3.7% |
| Bahamians | 1.1 /100 | #257 | Tragic 3.7% |
| Immigrants | St. Vincent and the Grenadines | 1.1 /100 | #258 | Tragic 3.7% |
| Africans | 1.0 /100 | #259 | Tragic 3.7% |
| Indonesians | 1.0 /100 | #260 | Tragic 3.7% |