Hawaiian vs Immigrants from Ecuador Professional Degree
COMPARE
Hawaiian
Immigrants from Ecuador
Professional Degree
Professional Degree Comparison
Hawaiians
Immigrants from Ecuador
3.4%
PROFESSIONAL DEGREE
0.2/ 100
METRIC RATING
296th/ 347
METRIC RANK
3.8%
PROFESSIONAL DEGREE
2.3/ 100
METRIC RATING
240th/ 347
METRIC RANK
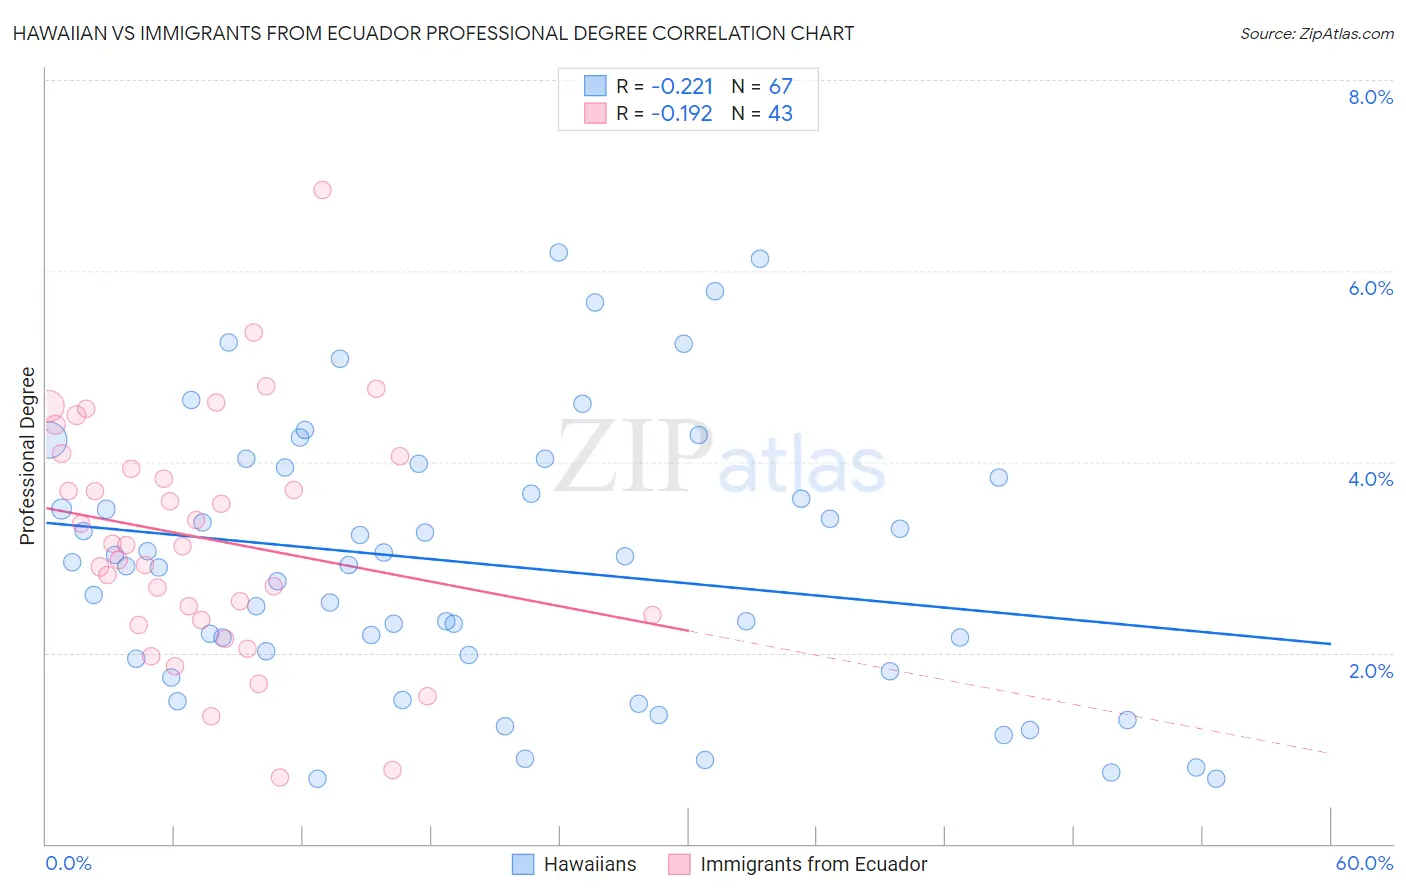
Hawaiian vs Immigrants from Ecuador Professional Degree Correlation Chart
The statistical analysis conducted on geographies consisting of 326,653,731 people shows a weak negative correlation between the proportion of Hawaiians and percentage of population with at least professional degree education in the United States with a correlation coefficient (R) of -0.221 and weighted average of 3.4%. Similarly, the statistical analysis conducted on geographies consisting of 270,711,574 people shows a poor negative correlation between the proportion of Immigrants from Ecuador and percentage of population with at least professional degree education in the United States with a correlation coefficient (R) of -0.192 and weighted average of 3.8%, a difference of 10.5%.
Professional Degree Correlation Summary
| Measurement | Hawaiian | Immigrants from Ecuador |
| Minimum | 0.68% | 0.70% |
| Maximum | 6.2% | 6.9% |
| Range | 5.5% | 6.2% |
| Mean | 2.9% | 3.2% |
| Median | 2.9% | 3.1% |
| Interquartile 25% (IQ1) | 1.9% | 2.3% |
| Interquartile 75% (IQ3) | 3.9% | 4.1% |
| Interquartile Range (IQR) | 2.0% | 1.7% |
| Standard Deviation (Sample) | 1.4% | 1.3% |
| Standard Deviation (Population) | 1.4% | 1.2% |
Similar Demographics by Professional Degree
Demographics Similar to Hawaiians by Professional Degree
In terms of professional degree, the demographic groups most similar to Hawaiians are Immigrants from Guatemala (3.4%, a difference of 0.010%), Paiute (3.4%, a difference of 0.16%), Immigrants from Honduras (3.5%, a difference of 0.25%), Immigrants from Liberia (3.4%, a difference of 0.34%), and Ottawa (3.4%, a difference of 0.39%).
| Demographics | Rating | Rank | Professional Degree |
| Guatemalans | 0.3 /100 | #289 | Tragic 3.5% |
| Chippewa | 0.3 /100 | #290 | Tragic 3.5% |
| Alaska Natives | 0.3 /100 | #291 | Tragic 3.5% |
| Immigrants | Belize | 0.3 /100 | #292 | Tragic 3.5% |
| Immigrants | Honduras | 0.3 /100 | #293 | Tragic 3.5% |
| Paiute | 0.3 /100 | #294 | Tragic 3.4% |
| Immigrants | Guatemala | 0.2 /100 | #295 | Tragic 3.4% |
| Hawaiians | 0.2 /100 | #296 | Tragic 3.4% |
| Immigrants | Liberia | 0.2 /100 | #297 | Tragic 3.4% |
| Ottawa | 0.2 /100 | #298 | Tragic 3.4% |
| Immigrants | Yemen | 0.2 /100 | #299 | Tragic 3.4% |
| Blacks/African Americans | 0.2 /100 | #300 | Tragic 3.4% |
| Immigrants | Dominican Republic | 0.2 /100 | #301 | Tragic 3.4% |
| Malaysians | 0.2 /100 | #302 | Tragic 3.4% |
| Immigrants | Haiti | 0.2 /100 | #303 | Tragic 3.4% |
Demographics Similar to Immigrants from Ecuador by Professional Degree
In terms of professional degree, the demographic groups most similar to Immigrants from Ecuador are Alaskan Athabascan (3.8%, a difference of 0.020%), Native Hawaiian (3.8%, a difference of 0.020%), Guamanian/Chamorro (3.8%, a difference of 0.10%), British West Indian (3.8%, a difference of 0.23%), and Immigrants from Bahamas (3.8%, a difference of 0.53%).
| Demographics | Rating | Rank | Professional Degree |
| Immigrants | Philippines | 4.1 /100 | #233 | Tragic 3.9% |
| Immigrants | Nonimmigrants | 4.0 /100 | #234 | Tragic 3.9% |
| Immigrants | Barbados | 4.0 /100 | #235 | Tragic 3.9% |
| Spanish Americans | 3.8 /100 | #236 | Tragic 3.9% |
| Immigrants | Trinidad and Tobago | 3.8 /100 | #237 | Tragic 3.9% |
| Colville | 2.6 /100 | #238 | Tragic 3.8% |
| British West Indians | 2.4 /100 | #239 | Tragic 3.8% |
| Immigrants | Ecuador | 2.3 /100 | #240 | Tragic 3.8% |
| Alaskan Athabascans | 2.3 /100 | #241 | Tragic 3.8% |
| Native Hawaiians | 2.3 /100 | #242 | Tragic 3.8% |
| Guamanians/Chamorros | 2.2 /100 | #243 | Tragic 3.8% |
| Immigrants | Bahamas | 2.0 /100 | #244 | Tragic 3.8% |
| French American Indians | 1.7 /100 | #245 | Tragic 3.8% |
| Marshallese | 1.7 /100 | #246 | Tragic 3.8% |
| Guyanese | 1.6 /100 | #247 | Tragic 3.8% |