Immigrants from Albania vs Hispanic or Latino Professional Degree
COMPARE
Immigrants from Albania
Hispanic or Latino
Professional Degree
Professional Degree Comparison
Immigrants from Albania
Hispanics or Latinos
4.8%
PROFESSIONAL DEGREE
93.3/ 100
METRIC RATING
125th/ 347
METRIC RANK
3.2%
PROFESSIONAL DEGREE
0.0/ 100
METRIC RATING
322nd/ 347
METRIC RANK
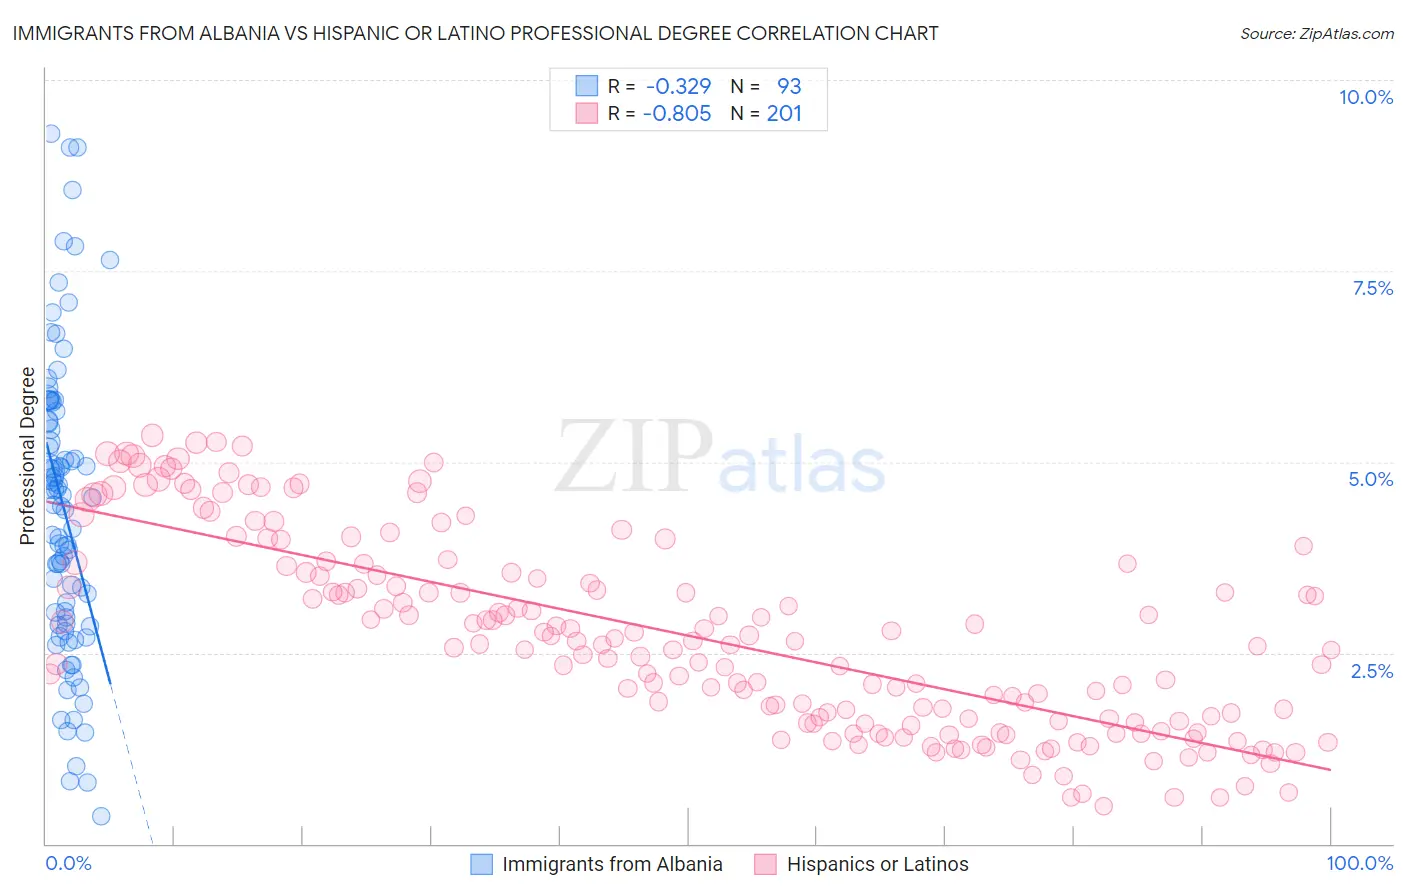
Immigrants from Albania vs Hispanic or Latino Professional Degree Correlation Chart
The statistical analysis conducted on geographies consisting of 119,335,838 people shows a mild negative correlation between the proportion of Immigrants from Albania and percentage of population with at least professional degree education in the United States with a correlation coefficient (R) of -0.329 and weighted average of 4.8%. Similarly, the statistical analysis conducted on geographies consisting of 568,625,989 people shows a very strong negative correlation between the proportion of Hispanics or Latinos and percentage of population with at least professional degree education in the United States with a correlation coefficient (R) of -0.805 and weighted average of 3.2%, a difference of 52.3%.
Professional Degree Correlation Summary
| Measurement | Immigrants from Albania | Hispanic or Latino |
| Minimum | 0.35% | 0.49% |
| Maximum | 9.3% | 5.3% |
| Range | 8.9% | 4.9% |
| Mean | 4.4% | 2.7% |
| Median | 4.4% | 2.6% |
| Interquartile 25% (IQ1) | 2.9% | 1.6% |
| Interquartile 75% (IQ3) | 5.6% | 3.6% |
| Interquartile Range (IQR) | 2.7% | 2.0% |
| Standard Deviation (Sample) | 2.0% | 1.3% |
| Standard Deviation (Population) | 1.9% | 1.3% |
Similar Demographics by Professional Degree
Demographics Similar to Immigrants from Albania by Professional Degree
In terms of professional degree, the demographic groups most similar to Immigrants from Albania are European (4.8%, a difference of 0.050%), Immigrants from Eritrea (4.8%, a difference of 0.12%), Immigrants from Venezuela (4.8%, a difference of 0.31%), Serbian (4.8%, a difference of 0.35%), and Immigrants from Eastern Africa (4.8%, a difference of 0.37%).
| Demographics | Rating | Rank | Professional Degree |
| Croatians | 96.0 /100 | #118 | Exceptional 4.9% |
| Immigrants | Sudan | 95.4 /100 | #119 | Exceptional 4.9% |
| Albanians | 95.3 /100 | #120 | Exceptional 4.9% |
| Immigrants | Moldova | 94.8 /100 | #121 | Exceptional 4.9% |
| Immigrants | Germany | 94.1 /100 | #122 | Exceptional 4.9% |
| Immigrants | Venezuela | 93.8 /100 | #123 | Exceptional 4.8% |
| Immigrants | Eritrea | 93.5 /100 | #124 | Exceptional 4.8% |
| Immigrants | Albania | 93.3 /100 | #125 | Exceptional 4.8% |
| Europeans | 93.2 /100 | #126 | Exceptional 4.8% |
| Serbians | 92.6 /100 | #127 | Exceptional 4.8% |
| Immigrants | Eastern Africa | 92.5 /100 | #128 | Exceptional 4.8% |
| Palestinians | 91.5 /100 | #129 | Exceptional 4.8% |
| Icelanders | 91.5 /100 | #130 | Exceptional 4.8% |
| Immigrants | Nepal | 91.4 /100 | #131 | Exceptional 4.8% |
| Pakistanis | 90.9 /100 | #132 | Exceptional 4.8% |
Demographics Similar to Hispanics or Latinos by Professional Degree
In terms of professional degree, the demographic groups most similar to Hispanics or Latinos are Inupiat (3.2%, a difference of 0.080%), Crow (3.2%, a difference of 0.35%), Tsimshian (3.2%, a difference of 0.36%), Yaqui (3.2%, a difference of 0.42%), and Seminole (3.2%, a difference of 0.72%).
| Demographics | Rating | Rank | Professional Degree |
| Immigrants | Laos | 0.1 /100 | #315 | Tragic 3.2% |
| Puerto Ricans | 0.1 /100 | #316 | Tragic 3.2% |
| Nepalese | 0.1 /100 | #317 | Tragic 3.2% |
| Immigrants | Micronesia | 0.1 /100 | #318 | Tragic 3.2% |
| Choctaw | 0.1 /100 | #319 | Tragic 3.2% |
| Seminole | 0.1 /100 | #320 | Tragic 3.2% |
| Tsimshian | 0.0 /100 | #321 | Tragic 3.2% |
| Hispanics or Latinos | 0.0 /100 | #322 | Tragic 3.2% |
| Inupiat | 0.0 /100 | #323 | Tragic 3.2% |
| Crow | 0.0 /100 | #324 | Tragic 3.2% |
| Yaqui | 0.0 /100 | #325 | Tragic 3.2% |
| Menominee | 0.0 /100 | #326 | Tragic 3.1% |
| Dutch West Indians | 0.0 /100 | #327 | Tragic 3.1% |
| Creek | 0.0 /100 | #328 | Tragic 3.1% |
| Bangladeshis | 0.0 /100 | #329 | Tragic 3.1% |