Cherokee vs Pueblo High School Diploma
COMPARE
Cherokee
Pueblo
High School Diploma
High School Diploma Comparison
Cherokee
Pueblo
88.5%
HIGH SCHOOL DIPLOMA
14.3/ 100
METRIC RATING
209th/ 347
METRIC RANK
86.5%
HIGH SCHOOL DIPLOMA
0.0/ 100
METRIC RATING
280th/ 347
METRIC RANK
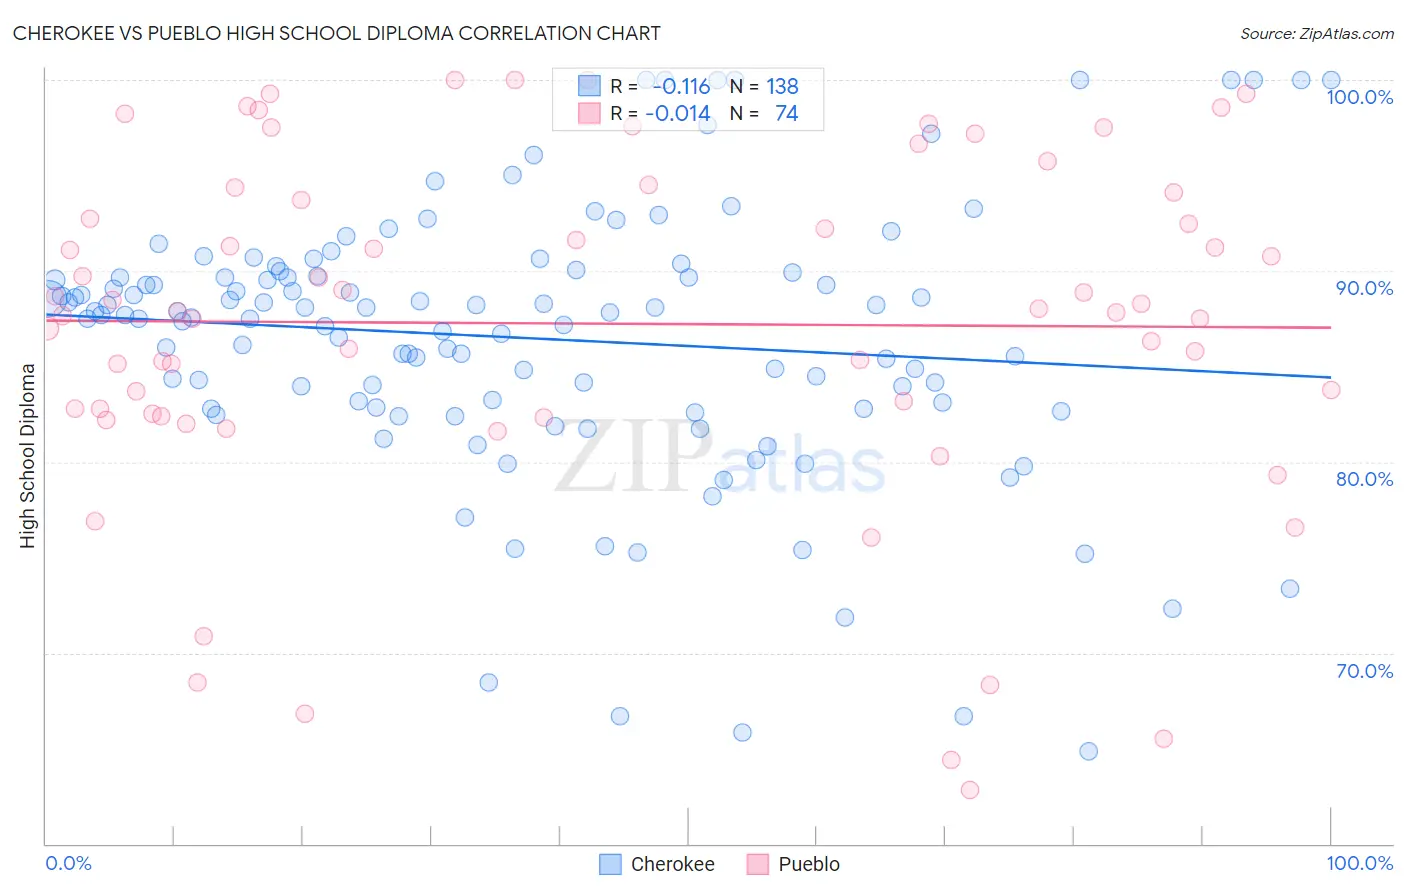
Cherokee vs Pueblo High School Diploma Correlation Chart
The statistical analysis conducted on geographies consisting of 493,720,047 people shows a poor negative correlation between the proportion of Cherokee and percentage of population with at least high school diploma education in the United States with a correlation coefficient (R) of -0.116 and weighted average of 88.5%. Similarly, the statistical analysis conducted on geographies consisting of 120,086,593 people shows no correlation between the proportion of Pueblo and percentage of population with at least high school diploma education in the United States with a correlation coefficient (R) of -0.014 and weighted average of 86.5%, a difference of 2.3%.
High School Diploma Correlation Summary
| Measurement | Cherokee | Pueblo |
| Minimum | 64.9% | 62.8% |
| Maximum | 100.0% | 100.0% |
| Range | 35.1% | 37.2% |
| Mean | 86.5% | 87.2% |
| Median | 87.7% | 88.0% |
| Interquartile 25% (IQ1) | 82.9% | 82.5% |
| Interquartile 75% (IQ3) | 89.7% | 94.1% |
| Interquartile Range (IQR) | 6.9% | 11.6% |
| Standard Deviation (Sample) | 7.1% | 9.1% |
| Standard Deviation (Population) | 7.0% | 9.1% |
Similar Demographics by High School Diploma
Demographics Similar to Cherokee by High School Diploma
In terms of high school diploma, the demographic groups most similar to Cherokee are Portuguese (88.5%, a difference of 0.0%), Samoan (88.5%, a difference of 0.010%), Immigrants from Sierra Leone (88.6%, a difference of 0.040%), Inupiat (88.5%, a difference of 0.040%), and Arapaho (88.6%, a difference of 0.050%).
| Demographics | Rating | Rank | High School Diploma |
| Panamanians | 18.0 /100 | #202 | Poor 88.6% |
| Somalis | 17.5 /100 | #203 | Poor 88.6% |
| Armenians | 17.2 /100 | #204 | Poor 88.6% |
| Immigrants | Micronesia | 16.4 /100 | #205 | Poor 88.6% |
| Arapaho | 16.1 /100 | #206 | Poor 88.6% |
| Immigrants | Sierra Leone | 15.8 /100 | #207 | Poor 88.6% |
| Portuguese | 14.4 /100 | #208 | Poor 88.5% |
| Cherokee | 14.3 /100 | #209 | Poor 88.5% |
| Samoans | 14.0 /100 | #210 | Poor 88.5% |
| Inupiat | 13.1 /100 | #211 | Poor 88.5% |
| South American Indians | 12.2 /100 | #212 | Poor 88.5% |
| Immigrants | Somalia | 11.3 /100 | #213 | Poor 88.4% |
| Immigrants | Cameroon | 10.9 /100 | #214 | Poor 88.4% |
| Crow | 10.9 /100 | #215 | Poor 88.4% |
| Chickasaw | 10.7 /100 | #216 | Poor 88.4% |
Demographics Similar to Pueblo by High School Diploma
In terms of high school diploma, the demographic groups most similar to Pueblo are Immigrants from Laos (86.6%, a difference of 0.020%), Indonesian (86.5%, a difference of 0.050%), Hopi (86.6%, a difference of 0.060%), Dutch West Indian (86.5%, a difference of 0.090%), and Immigrants from Barbados (86.4%, a difference of 0.15%).
| Demographics | Rating | Rank | High School Diploma |
| Immigrants | Jamaica | 0.1 /100 | #273 | Tragic 86.9% |
| Bangladeshis | 0.1 /100 | #274 | Tragic 86.9% |
| Immigrants | Trinidad and Tobago | 0.1 /100 | #275 | Tragic 86.8% |
| Immigrants | Burma/Myanmar | 0.1 /100 | #276 | Tragic 86.7% |
| Barbadians | 0.1 /100 | #277 | Tragic 86.7% |
| Hopi | 0.1 /100 | #278 | Tragic 86.6% |
| Immigrants | Laos | 0.0 /100 | #279 | Tragic 86.6% |
| Pueblo | 0.0 /100 | #280 | Tragic 86.5% |
| Indonesians | 0.0 /100 | #281 | Tragic 86.5% |
| Dutch West Indians | 0.0 /100 | #282 | Tragic 86.5% |
| Immigrants | Barbados | 0.0 /100 | #283 | Tragic 86.4% |
| Paiute | 0.0 /100 | #284 | Tragic 86.4% |
| Immigrants | West Indies | 0.0 /100 | #285 | Tragic 86.2% |
| Immigrants | St. Vincent and the Grenadines | 0.0 /100 | #286 | Tragic 86.2% |
| Ute | 0.0 /100 | #287 | Tragic 86.2% |