Native/Alaskan vs Nonimmigrants 11th Grade
COMPARE
Native/Alaskan
Nonimmigrants
11th Grade
11th Grade Comparison
Natives/Alaskans
Nonimmigrants
90.2%
11TH GRADE
0.0/ 100
METRIC RATING
293rd/ 347
METRIC RANK
92.7%
11TH GRADE
66.6/ 100
METRIC RATING
163rd/ 347
METRIC RANK
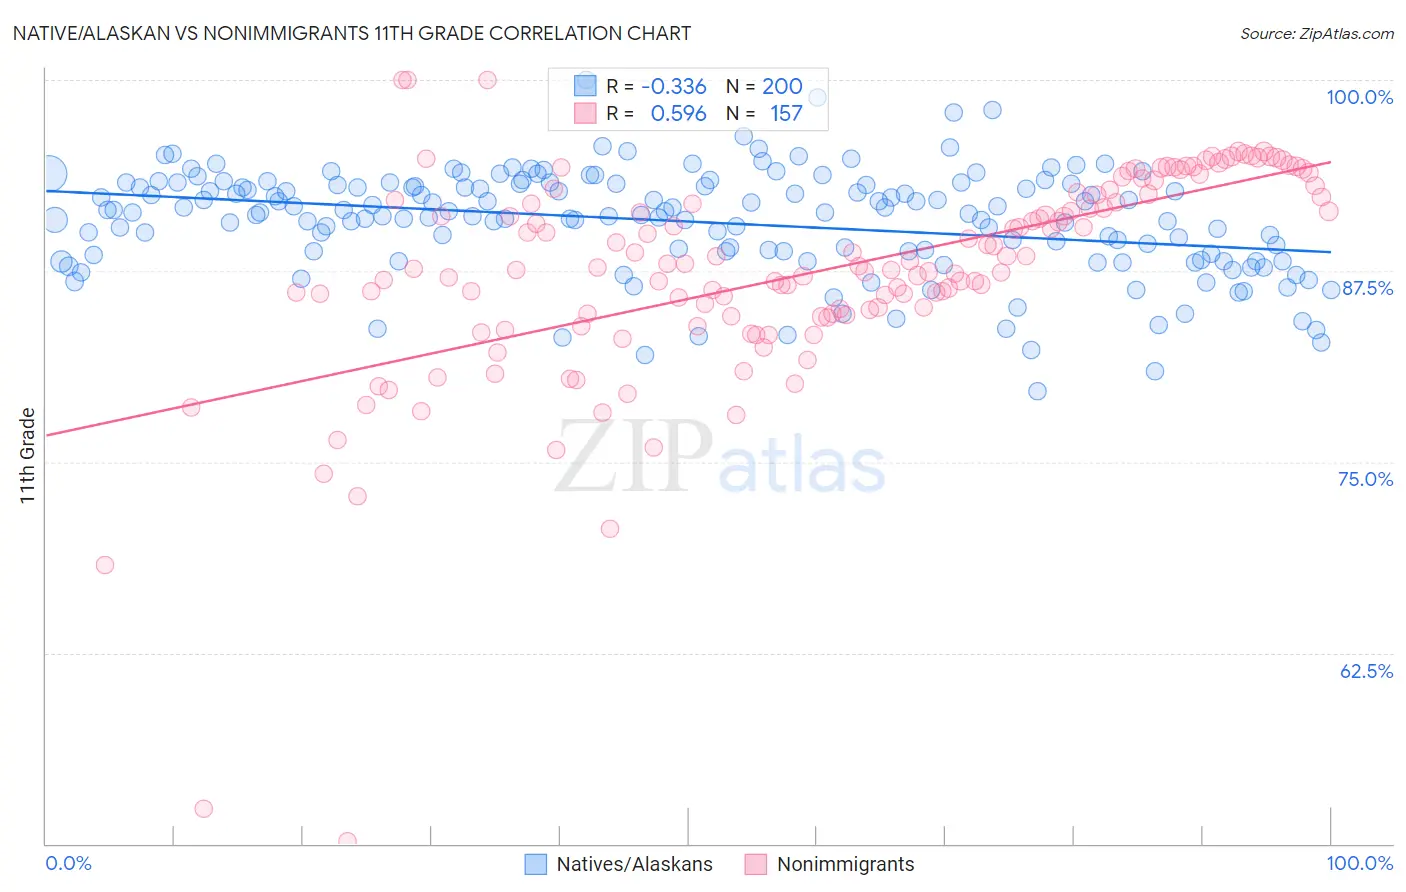
Native/Alaskan vs Nonimmigrants 11th Grade Correlation Chart
The statistical analysis conducted on geographies consisting of 513,075,819 people shows a mild negative correlation between the proportion of Natives/Alaskans and percentage of population with at least 11th grade education in the United States with a correlation coefficient (R) of -0.336 and weighted average of 90.2%. Similarly, the statistical analysis conducted on geographies consisting of 585,371,149 people shows a substantial positive correlation between the proportion of Nonimmigrants and percentage of population with at least 11th grade education in the United States with a correlation coefficient (R) of 0.596 and weighted average of 92.7%, a difference of 2.8%.
11th Grade Correlation Summary
| Measurement | Native/Alaskan | Nonimmigrants |
| Minimum | 79.7% | 50.2% |
| Maximum | 100.0% | 100.0% |
| Range | 20.3% | 49.8% |
| Mean | 90.7% | 87.5% |
| Median | 91.3% | 87.8% |
| Interquartile 25% (IQ1) | 88.7% | 84.6% |
| Interquartile 75% (IQ3) | 93.2% | 92.5% |
| Interquartile Range (IQR) | 4.5% | 7.9% |
| Standard Deviation (Sample) | 3.5% | 7.1% |
| Standard Deviation (Population) | 3.4% | 7.1% |
Similar Demographics by 11th Grade
Demographics Similar to Natives/Alaskans by 11th Grade
In terms of 11th grade, the demographic groups most similar to Natives/Alaskans are Immigrants from Grenada (90.1%, a difference of 0.050%), Cuban (90.2%, a difference of 0.070%), Haitian (90.3%, a difference of 0.10%), Indonesian (90.3%, a difference of 0.14%), and Immigrants from Vietnam (90.0%, a difference of 0.15%).
| Demographics | Rating | Rank | 11th Grade |
| Immigrants | West Indies | 0.0 /100 | #286 | Tragic 90.4% |
| Apache | 0.0 /100 | #287 | Tragic 90.4% |
| Pennsylvania Germans | 0.0 /100 | #288 | Tragic 90.3% |
| British West Indians | 0.0 /100 | #289 | Tragic 90.3% |
| Indonesians | 0.0 /100 | #290 | Tragic 90.3% |
| Haitians | 0.0 /100 | #291 | Tragic 90.3% |
| Cubans | 0.0 /100 | #292 | Tragic 90.2% |
| Natives/Alaskans | 0.0 /100 | #293 | Tragic 90.2% |
| Immigrants | Grenada | 0.0 /100 | #294 | Tragic 90.1% |
| Immigrants | Vietnam | 0.0 /100 | #295 | Tragic 90.0% |
| Fijians | 0.0 /100 | #296 | Tragic 90.0% |
| Navajo | 0.0 /100 | #297 | Tragic 90.0% |
| Immigrants | Fiji | 0.0 /100 | #298 | Tragic 89.9% |
| Japanese | 0.0 /100 | #299 | Tragic 89.9% |
| Immigrants | Haiti | 0.0 /100 | #300 | Tragic 89.9% |
Demographics Similar to Nonimmigrants by 11th Grade
In terms of 11th grade, the demographic groups most similar to Nonimmigrants are Spanish (92.7%, a difference of 0.0%), Paraguayan (92.7%, a difference of 0.020%), Immigrants from Iraq (92.6%, a difference of 0.030%), Immigrants from Argentina (92.7%, a difference of 0.040%), and Immigrants from Lebanon (92.7%, a difference of 0.050%).
| Demographics | Rating | Rank | 11th Grade |
| Immigrants | Spain | 73.0 /100 | #156 | Good 92.7% |
| Immigrants | Eastern Asia | 72.6 /100 | #157 | Good 92.7% |
| Immigrants | Venezuela | 72.0 /100 | #158 | Good 92.7% |
| Americans | 71.7 /100 | #159 | Good 92.7% |
| Immigrants | Lebanon | 70.7 /100 | #160 | Good 92.7% |
| Immigrants | Argentina | 69.8 /100 | #161 | Good 92.7% |
| Paraguayans | 68.7 /100 | #162 | Good 92.7% |
| Immigrants | Nonimmigrants | 66.6 /100 | #163 | Good 92.7% |
| Spanish | 66.2 /100 | #164 | Good 92.7% |
| Immigrants | Iraq | 63.7 /100 | #165 | Good 92.6% |
| Bermudans | 62.3 /100 | #166 | Good 92.6% |
| Alsatians | 60.2 /100 | #167 | Good 92.6% |
| Sierra Leoneans | 58.7 /100 | #168 | Average 92.6% |
| Immigrants | Albania | 57.8 /100 | #169 | Average 92.6% |
| Immigrants | Northern Africa | 57.3 /100 | #170 | Average 92.6% |