Native/Alaskan vs Immigrants from the Azores 11th Grade
COMPARE
Native/Alaskan
Immigrants from the Azores
11th Grade
11th Grade Comparison
Natives/Alaskans
Immigrants from the Azores
90.2%
11TH GRADE
0.0/ 100
METRIC RATING
293rd/ 347
METRIC RANK
87.2%
11TH GRADE
0.0/ 100
METRIC RATING
332nd/ 347
METRIC RANK
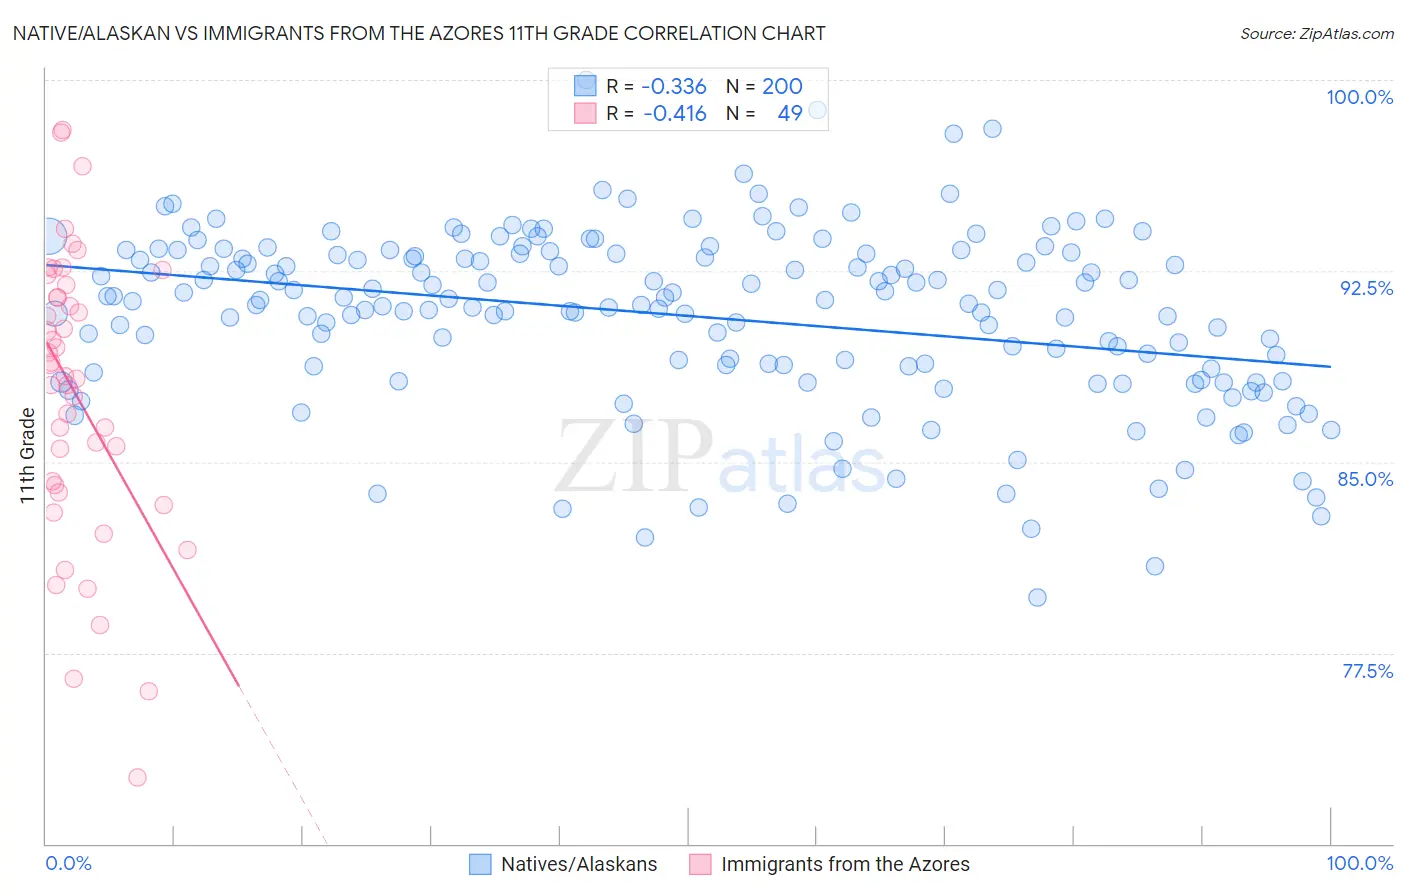
Native/Alaskan vs Immigrants from the Azores 11th Grade Correlation Chart
The statistical analysis conducted on geographies consisting of 513,075,819 people shows a mild negative correlation between the proportion of Natives/Alaskans and percentage of population with at least 11th grade education in the United States with a correlation coefficient (R) of -0.336 and weighted average of 90.2%. Similarly, the statistical analysis conducted on geographies consisting of 46,257,310 people shows a moderate negative correlation between the proportion of Immigrants from the Azores and percentage of population with at least 11th grade education in the United States with a correlation coefficient (R) of -0.416 and weighted average of 87.2%, a difference of 3.4%.
11th Grade Correlation Summary
| Measurement | Native/Alaskan | Immigrants from the Azores |
| Minimum | 79.7% | 72.6% |
| Maximum | 100.0% | 98.0% |
| Range | 20.3% | 25.4% |
| Mean | 90.7% | 87.6% |
| Median | 91.3% | 88.3% |
| Interquartile 25% (IQ1) | 88.7% | 83.9% |
| Interquartile 75% (IQ3) | 93.2% | 91.7% |
| Interquartile Range (IQR) | 4.5% | 7.8% |
| Standard Deviation (Sample) | 3.5% | 5.6% |
| Standard Deviation (Population) | 3.4% | 5.6% |
Similar Demographics by 11th Grade
Demographics Similar to Natives/Alaskans by 11th Grade
In terms of 11th grade, the demographic groups most similar to Natives/Alaskans are Immigrants from Grenada (90.1%, a difference of 0.050%), Cuban (90.2%, a difference of 0.070%), Haitian (90.3%, a difference of 0.10%), Indonesian (90.3%, a difference of 0.14%), and Immigrants from Vietnam (90.0%, a difference of 0.15%).
| Demographics | Rating | Rank | 11th Grade |
| Immigrants | West Indies | 0.0 /100 | #286 | Tragic 90.4% |
| Apache | 0.0 /100 | #287 | Tragic 90.4% |
| Pennsylvania Germans | 0.0 /100 | #288 | Tragic 90.3% |
| British West Indians | 0.0 /100 | #289 | Tragic 90.3% |
| Indonesians | 0.0 /100 | #290 | Tragic 90.3% |
| Haitians | 0.0 /100 | #291 | Tragic 90.3% |
| Cubans | 0.0 /100 | #292 | Tragic 90.2% |
| Natives/Alaskans | 0.0 /100 | #293 | Tragic 90.2% |
| Immigrants | Grenada | 0.0 /100 | #294 | Tragic 90.1% |
| Immigrants | Vietnam | 0.0 /100 | #295 | Tragic 90.0% |
| Fijians | 0.0 /100 | #296 | Tragic 90.0% |
| Navajo | 0.0 /100 | #297 | Tragic 90.0% |
| Immigrants | Fiji | 0.0 /100 | #298 | Tragic 89.9% |
| Japanese | 0.0 /100 | #299 | Tragic 89.9% |
| Immigrants | Haiti | 0.0 /100 | #300 | Tragic 89.9% |
Demographics Similar to Immigrants from the Azores by 11th Grade
In terms of 11th grade, the demographic groups most similar to Immigrants from the Azores are Hispanic or Latino (87.3%, a difference of 0.090%), Honduran (87.4%, a difference of 0.16%), Immigrants from Yemen (87.1%, a difference of 0.17%), Houma (87.0%, a difference of 0.24%), and Central American (86.9%, a difference of 0.33%).
| Demographics | Rating | Rank | 11th Grade |
| Immigrants | Nicaragua | 0.0 /100 | #325 | Tragic 88.1% |
| Dominicans | 0.0 /100 | #326 | Tragic 87.7% |
| Immigrants | Cabo Verde | 0.0 /100 | #327 | Tragic 87.6% |
| Tohono O'odham | 0.0 /100 | #328 | Tragic 87.6% |
| Mexican American Indians | 0.0 /100 | #329 | Tragic 87.5% |
| Hondurans | 0.0 /100 | #330 | Tragic 87.4% |
| Hispanics or Latinos | 0.0 /100 | #331 | Tragic 87.3% |
| Immigrants | Azores | 0.0 /100 | #332 | Tragic 87.2% |
| Immigrants | Yemen | 0.0 /100 | #333 | Tragic 87.1% |
| Houma | 0.0 /100 | #334 | Tragic 87.0% |
| Central Americans | 0.0 /100 | #335 | Tragic 86.9% |
| Immigrants | Dominican Republic | 0.0 /100 | #336 | Tragic 86.9% |
| Immigrants | Honduras | 0.0 /100 | #337 | Tragic 86.9% |
| Immigrants | Latin America | 0.0 /100 | #338 | Tragic 86.8% |
| Guatemalans | 0.0 /100 | #339 | Tragic 86.4% |