Irish vs Dutch Bachelor's Degree
COMPARE
Irish
Dutch
Bachelor's Degree
Bachelor's Degree Comparison
Irish
Dutch
37.6%
BACHELOR'S DEGREE
44.3/ 100
METRIC RATING
180th/ 347
METRIC RANK
35.7%
BACHELOR'S DEGREE
9.2/ 100
METRIC RATING
221st/ 347
METRIC RANK
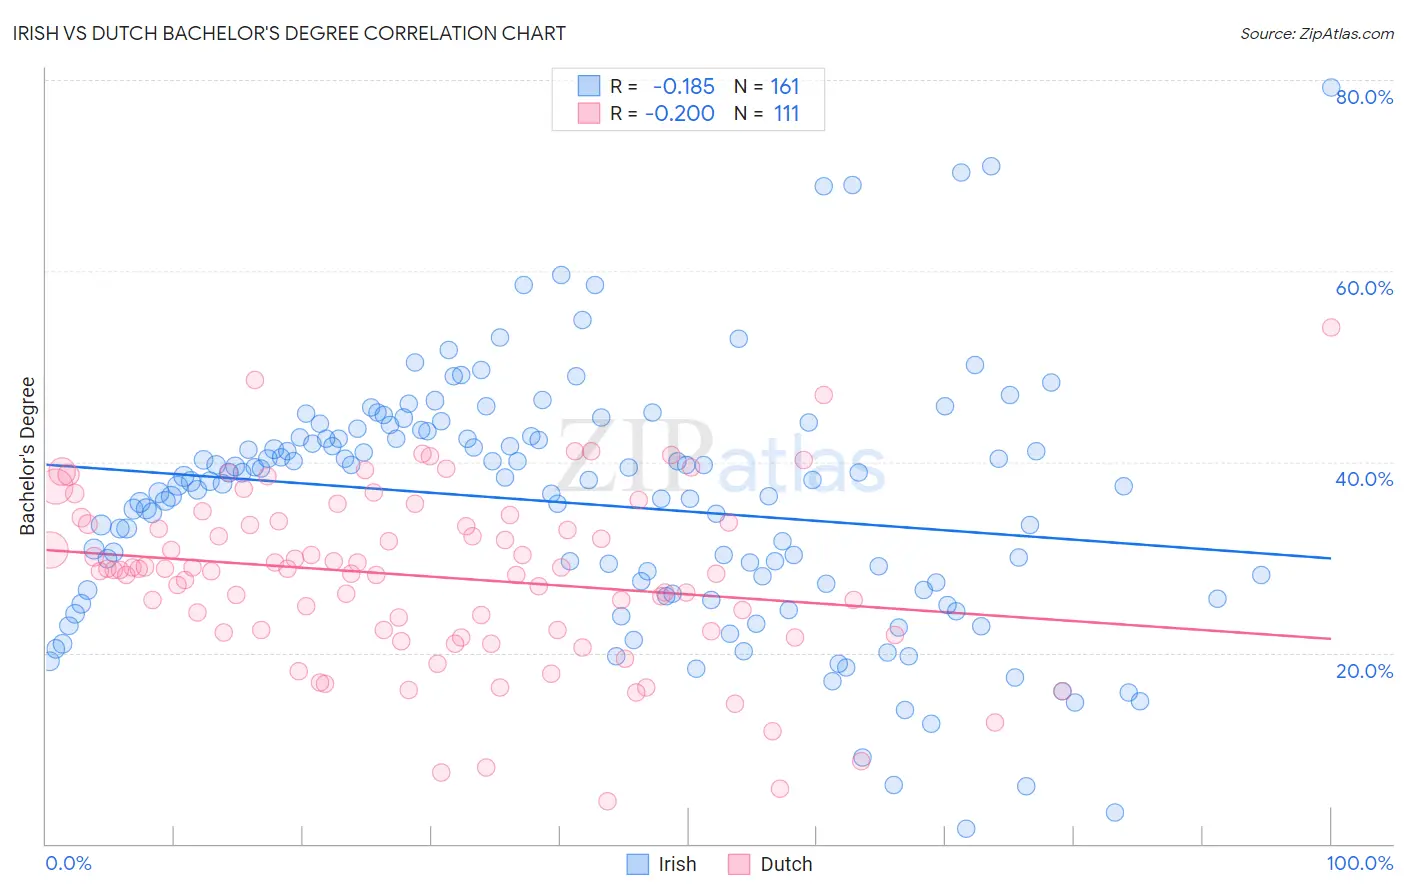
Irish vs Dutch Bachelor's Degree Correlation Chart
The statistical analysis conducted on geographies consisting of 580,386,909 people shows a poor negative correlation between the proportion of Irish and percentage of population with at least bachelor's degree education in the United States with a correlation coefficient (R) of -0.185 and weighted average of 37.6%. Similarly, the statistical analysis conducted on geographies consisting of 554,248,334 people shows a weak negative correlation between the proportion of Dutch and percentage of population with at least bachelor's degree education in the United States with a correlation coefficient (R) of -0.200 and weighted average of 35.7%, a difference of 5.3%.
Bachelor's Degree Correlation Summary
| Measurement | Irish | Dutch |
| Minimum | 1.6% | 4.5% |
| Maximum | 79.2% | 54.1% |
| Range | 77.6% | 49.5% |
| Mean | 35.7% | 28.0% |
| Median | 37.9% | 28.7% |
| Interquartile 25% (IQ1) | 26.6% | 22.2% |
| Interquartile 75% (IQ3) | 42.6% | 33.7% |
| Interquartile Range (IQR) | 16.1% | 11.4% |
| Standard Deviation (Sample) | 13.0% | 9.1% |
| Standard Deviation (Population) | 13.0% | 9.0% |
Similar Demographics by Bachelor's Degree
Demographics Similar to Irish by Bachelor's Degree
In terms of bachelor's degree, the demographic groups most similar to Irish are Immigrants from Senegal (37.6%, a difference of 0.050%), Immigrants from Bosnia and Herzegovina (37.6%, a difference of 0.090%), Immigrants from Colombia (37.7%, a difference of 0.11%), Senegalese (37.5%, a difference of 0.21%), and Immigrants from Cameroon (37.7%, a difference of 0.24%).
| Demographics | Rating | Rank | Bachelor's Degree |
| Immigrants | Iraq | 52.5 /100 | #173 | Average 37.9% |
| Immigrants | Bangladesh | 50.0 /100 | #174 | Average 37.8% |
| Immigrants | Uruguay | 48.3 /100 | #175 | Average 37.8% |
| Costa Ricans | 47.6 /100 | #176 | Average 37.7% |
| Basques | 47.4 /100 | #177 | Average 37.7% |
| Immigrants | Cameroon | 46.8 /100 | #178 | Average 37.7% |
| Immigrants | Colombia | 45.4 /100 | #179 | Average 37.7% |
| Irish | 44.3 /100 | #180 | Average 37.6% |
| Immigrants | Senegal | 43.8 /100 | #181 | Average 37.6% |
| Immigrants | Bosnia and Herzegovina | 43.4 /100 | #182 | Average 37.6% |
| Senegalese | 42.2 /100 | #183 | Average 37.5% |
| Scandinavians | 41.7 /100 | #184 | Average 37.5% |
| Immigrants | Peru | 41.3 /100 | #185 | Average 37.5% |
| Norwegians | 40.4 /100 | #186 | Average 37.5% |
| English | 39.7 /100 | #187 | Fair 37.4% |
Demographics Similar to Dutch by Bachelor's Degree
In terms of bachelor's degree, the demographic groups most similar to Dutch are Spanish (35.8%, a difference of 0.11%), Trinidadian and Tobagonian (35.7%, a difference of 0.14%), West Indian (35.8%, a difference of 0.15%), Subsaharan African (35.8%, a difference of 0.18%), and German Russian (35.8%, a difference of 0.28%).
| Demographics | Rating | Rank | Bachelor's Degree |
| Germans | 13.9 /100 | #214 | Poor 36.1% |
| Immigrants | Western Africa | 13.8 /100 | #215 | Poor 36.1% |
| Barbadians | 13.5 /100 | #216 | Poor 36.1% |
| German Russians | 10.2 /100 | #217 | Poor 35.8% |
| Sub-Saharan Africans | 9.8 /100 | #218 | Tragic 35.8% |
| West Indians | 9.7 /100 | #219 | Tragic 35.8% |
| Spanish | 9.6 /100 | #220 | Tragic 35.8% |
| Dutch | 9.2 /100 | #221 | Tragic 35.7% |
| Trinidadians and Tobagonians | 8.8 /100 | #222 | Tragic 35.7% |
| French Canadians | 8.3 /100 | #223 | Tragic 35.6% |
| Immigrants | Barbados | 7.5 /100 | #224 | Tragic 35.5% |
| Immigrants | Burma/Myanmar | 7.3 /100 | #225 | Tragic 35.5% |
| Portuguese | 7.2 /100 | #226 | Tragic 35.5% |
| Ecuadorians | 6.6 /100 | #227 | Tragic 35.4% |
| Immigrants | Trinidad and Tobago | 6.0 /100 | #228 | Tragic 35.3% |