Native/Alaskan vs Immigrants from France Bachelor's Degree
COMPARE
Native/Alaskan
Immigrants from France
Bachelor's Degree
Bachelor's Degree Comparison
Natives/Alaskans
Immigrants from France
26.3%
BACHELOR'S DEGREE
0.0/ 100
METRIC RATING
335th/ 347
METRIC RANK
46.4%
BACHELOR'S DEGREE
100.0/ 100
METRIC RATING
27th/ 347
METRIC RANK
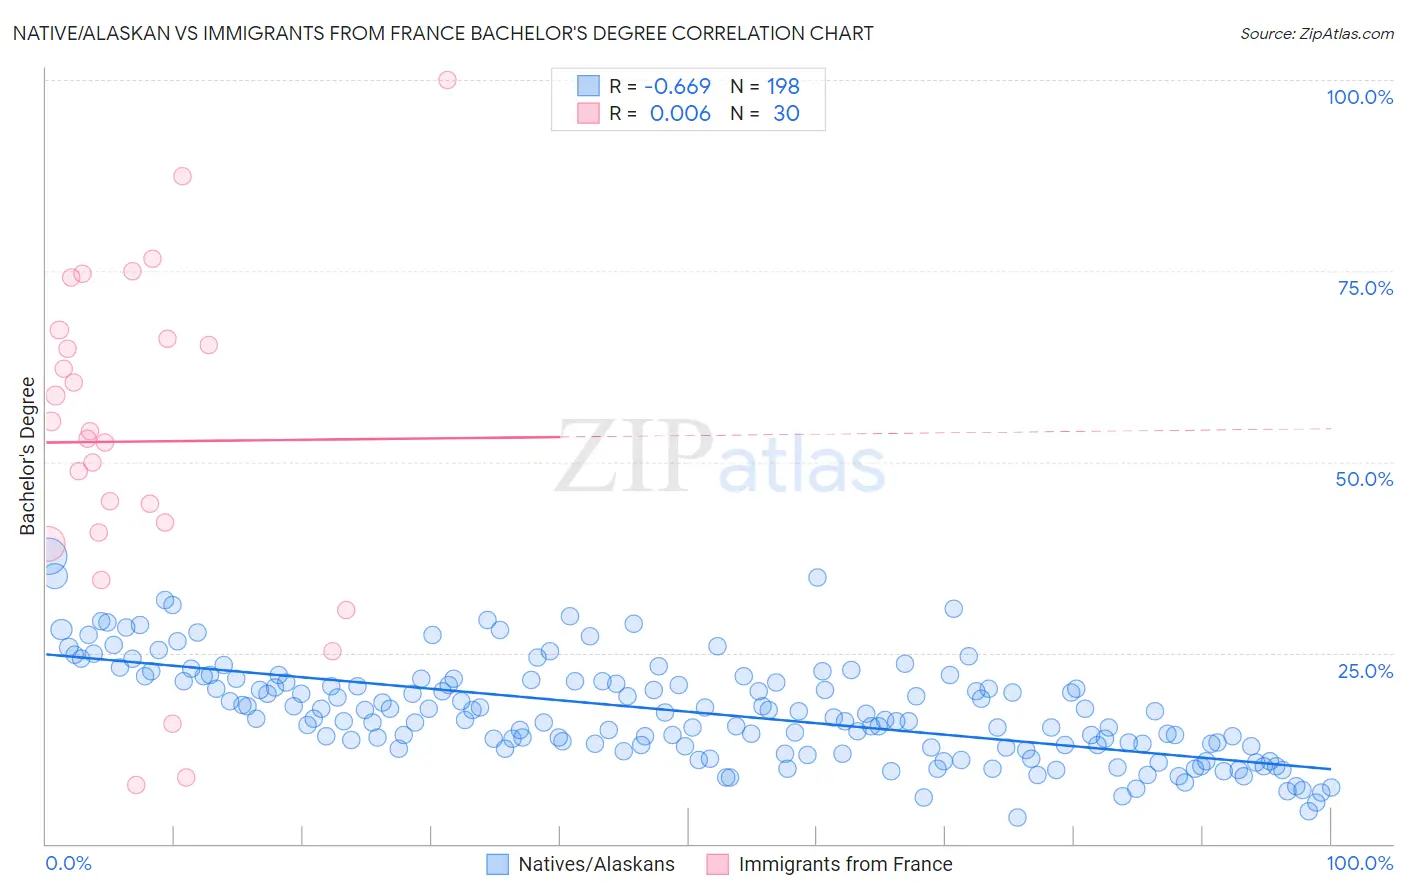
Native/Alaskan vs Immigrants from France Bachelor's Degree Correlation Chart
The statistical analysis conducted on geographies consisting of 512,966,883 people shows a significant negative correlation between the proportion of Natives/Alaskans and percentage of population with at least bachelor's degree education in the United States with a correlation coefficient (R) of -0.669 and weighted average of 26.3%. Similarly, the statistical analysis conducted on geographies consisting of 287,908,561 people shows no correlation between the proportion of Immigrants from France and percentage of population with at least bachelor's degree education in the United States with a correlation coefficient (R) of 0.006 and weighted average of 46.4%, a difference of 76.3%.
Bachelor's Degree Correlation Summary
| Measurement | Native/Alaskan | Immigrants from France |
| Minimum | 3.5% | 7.7% |
| Maximum | 37.7% | 100.0% |
| Range | 34.2% | 92.3% |
| Mean | 17.3% | 52.7% |
| Median | 16.5% | 53.5% |
| Interquartile 25% (IQ1) | 12.7% | 40.8% |
| Interquartile 75% (IQ3) | 21.3% | 66.2% |
| Interquartile Range (IQR) | 8.6% | 25.3% |
| Standard Deviation (Sample) | 6.5% | 21.8% |
| Standard Deviation (Population) | 6.5% | 21.5% |
Similar Demographics by Bachelor's Degree
Demographics Similar to Natives/Alaskans by Bachelor's Degree
In terms of bachelor's degree, the demographic groups most similar to Natives/Alaskans are Immigrants from Mexico (26.1%, a difference of 0.70%), Arapaho (26.6%, a difference of 1.1%), Inupiat (25.8%, a difference of 2.0%), Mexican (27.1%, a difference of 2.9%), and Pueblo (25.5%, a difference of 3.1%).
| Demographics | Rating | Rank | Bachelor's Degree |
| Crow | 0.0 /100 | #328 | Tragic 27.7% |
| Immigrants | Central America | 0.0 /100 | #329 | Tragic 27.5% |
| Spanish American Indians | 0.0 /100 | #330 | Tragic 27.5% |
| Immigrants | Azores | 0.0 /100 | #331 | Tragic 27.3% |
| Menominee | 0.0 /100 | #332 | Tragic 27.3% |
| Mexicans | 0.0 /100 | #333 | Tragic 27.1% |
| Arapaho | 0.0 /100 | #334 | Tragic 26.6% |
| Natives/Alaskans | 0.0 /100 | #335 | Tragic 26.3% |
| Immigrants | Mexico | 0.0 /100 | #336 | Tragic 26.1% |
| Inupiat | 0.0 /100 | #337 | Tragic 25.8% |
| Pueblo | 0.0 /100 | #338 | Tragic 25.5% |
| Hopi | 0.0 /100 | #339 | Tragic 25.3% |
| Lumbee | 0.0 /100 | #340 | Tragic 24.8% |
| Yuman | 0.0 /100 | #341 | Tragic 24.5% |
| Yakama | 0.0 /100 | #342 | Tragic 24.5% |
Demographics Similar to Immigrants from France by Bachelor's Degree
In terms of bachelor's degree, the demographic groups most similar to Immigrants from France are Turkish (46.2%, a difference of 0.46%), Israeli (46.1%, a difference of 0.59%), Immigrants from Sri Lanka (46.1%, a difference of 0.64%), Latvian (46.1%, a difference of 0.68%), and Immigrants from Japan (46.8%, a difference of 0.91%).
| Demographics | Rating | Rank | Bachelor's Degree |
| Immigrants | Switzerland | 100.0 /100 | #20 | Exceptional 47.1% |
| Immigrants | Ireland | 100.0 /100 | #21 | Exceptional 47.1% |
| Immigrants | Belgium | 100.0 /100 | #22 | Exceptional 47.0% |
| Immigrants | Sweden | 100.0 /100 | #23 | Exceptional 47.0% |
| Immigrants | Korea | 100.0 /100 | #24 | Exceptional 47.0% |
| Burmese | 100.0 /100 | #25 | Exceptional 46.9% |
| Immigrants | Japan | 100.0 /100 | #26 | Exceptional 46.8% |
| Immigrants | France | 100.0 /100 | #27 | Exceptional 46.4% |
| Turks | 100.0 /100 | #28 | Exceptional 46.2% |
| Israelis | 100.0 /100 | #29 | Exceptional 46.1% |
| Immigrants | Sri Lanka | 100.0 /100 | #30 | Exceptional 46.1% |
| Latvians | 100.0 /100 | #31 | Exceptional 46.1% |
| Immigrants | Turkey | 100.0 /100 | #32 | Exceptional 46.0% |
| Immigrants | Northern Europe | 100.0 /100 | #33 | Exceptional 45.6% |
| Immigrants | Denmark | 100.0 /100 | #34 | Exceptional 45.4% |