Immigrants from Israel vs Dutch Bachelor's Degree
COMPARE
Immigrants from Israel
Dutch
Bachelor's Degree
Bachelor's Degree Comparison
Immigrants from Israel
Dutch
50.0%
BACHELOR'S DEGREE
100.0/ 100
METRIC RATING
9th/ 347
METRIC RANK
35.7%
BACHELOR'S DEGREE
9.2/ 100
METRIC RATING
221st/ 347
METRIC RANK
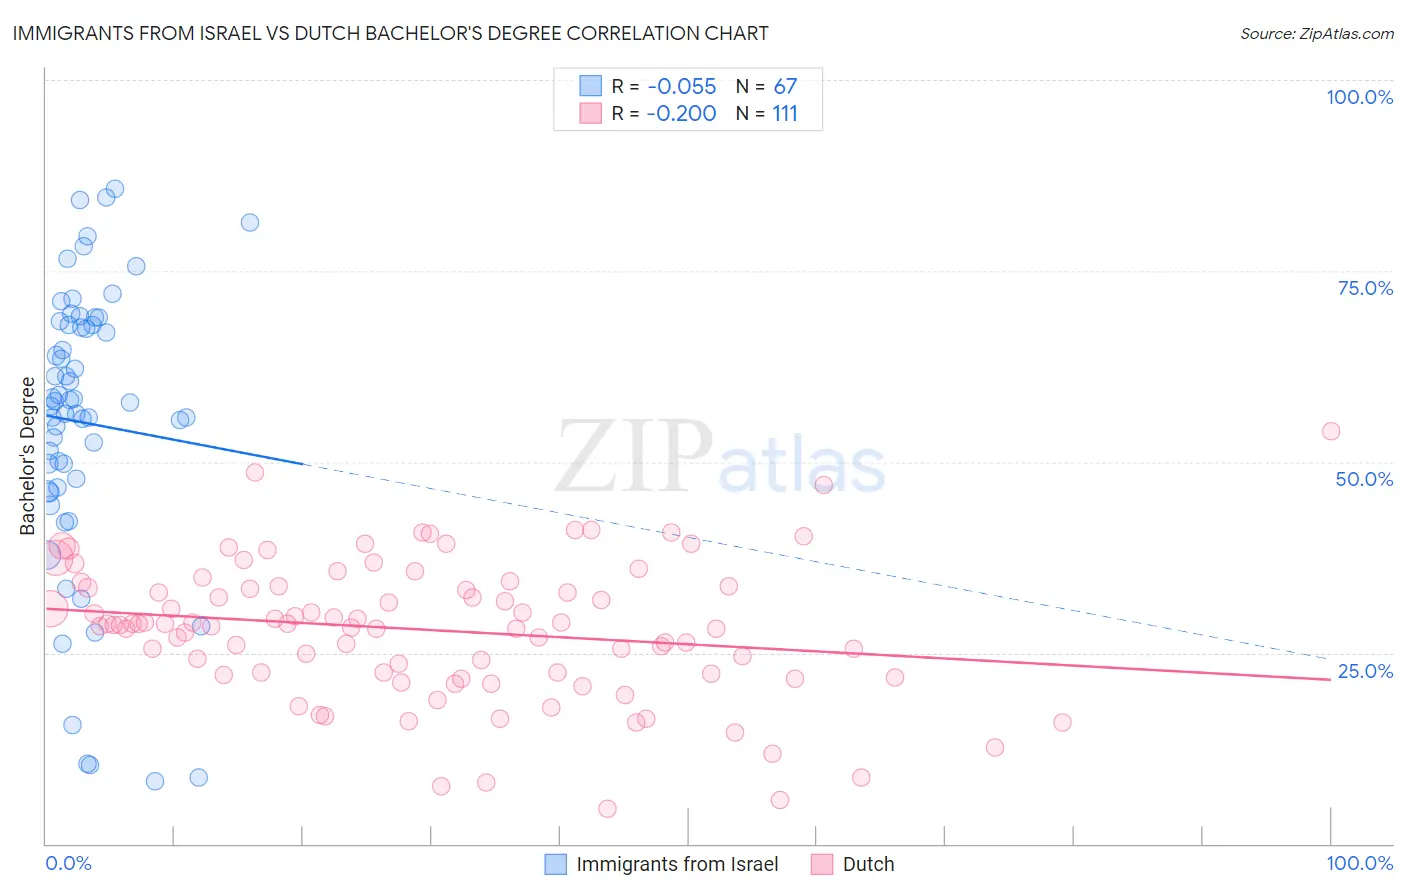
Immigrants from Israel vs Dutch Bachelor's Degree Correlation Chart
The statistical analysis conducted on geographies consisting of 210,024,310 people shows a slight negative correlation between the proportion of Immigrants from Israel and percentage of population with at least bachelor's degree education in the United States with a correlation coefficient (R) of -0.055 and weighted average of 50.0%. Similarly, the statistical analysis conducted on geographies consisting of 554,248,334 people shows a weak negative correlation between the proportion of Dutch and percentage of population with at least bachelor's degree education in the United States with a correlation coefficient (R) of -0.200 and weighted average of 35.7%, a difference of 40.0%.
Bachelor's Degree Correlation Summary
| Measurement | Immigrants from Israel | Dutch |
| Minimum | 8.2% | 4.5% |
| Maximum | 85.8% | 54.1% |
| Range | 77.5% | 49.5% |
| Mean | 55.1% | 28.0% |
| Median | 57.8% | 28.7% |
| Interquartile 25% (IQ1) | 46.6% | 22.2% |
| Interquartile 75% (IQ3) | 67.9% | 33.7% |
| Interquartile Range (IQR) | 21.3% | 11.4% |
| Standard Deviation (Sample) | 18.6% | 9.1% |
| Standard Deviation (Population) | 18.4% | 9.0% |
Similar Demographics by Bachelor's Degree
Demographics Similar to Immigrants from Israel by Bachelor's Degree
In terms of bachelor's degree, the demographic groups most similar to Immigrants from Israel are Thai (50.1%, a difference of 0.24%), Immigrants from Iran (50.3%, a difference of 0.61%), Okinawan (50.5%, a difference of 1.1%), Iranian (51.0%, a difference of 1.9%), and Cypriot (49.0%, a difference of 1.9%).
| Demographics | Rating | Rank | Bachelor's Degree |
| Immigrants | Singapore | 100.0 /100 | #2 | Exceptional 51.9% |
| Immigrants | India | 100.0 /100 | #3 | Exceptional 51.3% |
| Immigrants | Taiwan | 100.0 /100 | #4 | Exceptional 51.2% |
| Iranians | 100.0 /100 | #5 | Exceptional 51.0% |
| Okinawans | 100.0 /100 | #6 | Exceptional 50.5% |
| Immigrants | Iran | 100.0 /100 | #7 | Exceptional 50.3% |
| Thais | 100.0 /100 | #8 | Exceptional 50.1% |
| Immigrants | Israel | 100.0 /100 | #9 | Exceptional 50.0% |
| Cypriots | 100.0 /100 | #10 | Exceptional 49.0% |
| Immigrants | Australia | 100.0 /100 | #11 | Exceptional 48.5% |
| Immigrants | China | 100.0 /100 | #12 | Exceptional 48.4% |
| Immigrants | South Central Asia | 100.0 /100 | #13 | Exceptional 48.3% |
| Immigrants | Hong Kong | 100.0 /100 | #14 | Exceptional 48.2% |
| Immigrants | Eastern Asia | 100.0 /100 | #15 | Exceptional 48.1% |
| Soviet Union | 100.0 /100 | #16 | Exceptional 47.9% |
Demographics Similar to Dutch by Bachelor's Degree
In terms of bachelor's degree, the demographic groups most similar to Dutch are Spanish (35.8%, a difference of 0.11%), Trinidadian and Tobagonian (35.7%, a difference of 0.14%), West Indian (35.8%, a difference of 0.15%), Subsaharan African (35.8%, a difference of 0.18%), and German Russian (35.8%, a difference of 0.28%).
| Demographics | Rating | Rank | Bachelor's Degree |
| Germans | 13.9 /100 | #214 | Poor 36.1% |
| Immigrants | Western Africa | 13.8 /100 | #215 | Poor 36.1% |
| Barbadians | 13.5 /100 | #216 | Poor 36.1% |
| German Russians | 10.2 /100 | #217 | Poor 35.8% |
| Sub-Saharan Africans | 9.8 /100 | #218 | Tragic 35.8% |
| West Indians | 9.7 /100 | #219 | Tragic 35.8% |
| Spanish | 9.6 /100 | #220 | Tragic 35.8% |
| Dutch | 9.2 /100 | #221 | Tragic 35.7% |
| Trinidadians and Tobagonians | 8.8 /100 | #222 | Tragic 35.7% |
| French Canadians | 8.3 /100 | #223 | Tragic 35.6% |
| Immigrants | Barbados | 7.5 /100 | #224 | Tragic 35.5% |
| Immigrants | Burma/Myanmar | 7.3 /100 | #225 | Tragic 35.5% |
| Portuguese | 7.2 /100 | #226 | Tragic 35.5% |
| Ecuadorians | 6.6 /100 | #227 | Tragic 35.4% |
| Immigrants | Trinidad and Tobago | 6.0 /100 | #228 | Tragic 35.3% |