Northern European vs Dutch Bachelor's Degree
COMPARE
Northern European
Dutch
Bachelor's Degree
Bachelor's Degree Comparison
Northern Europeans
Dutch
41.0%
BACHELOR'S DEGREE
96.8/ 100
METRIC RATING
107th/ 347
METRIC RANK
35.7%
BACHELOR'S DEGREE
9.2/ 100
METRIC RATING
221st/ 347
METRIC RANK
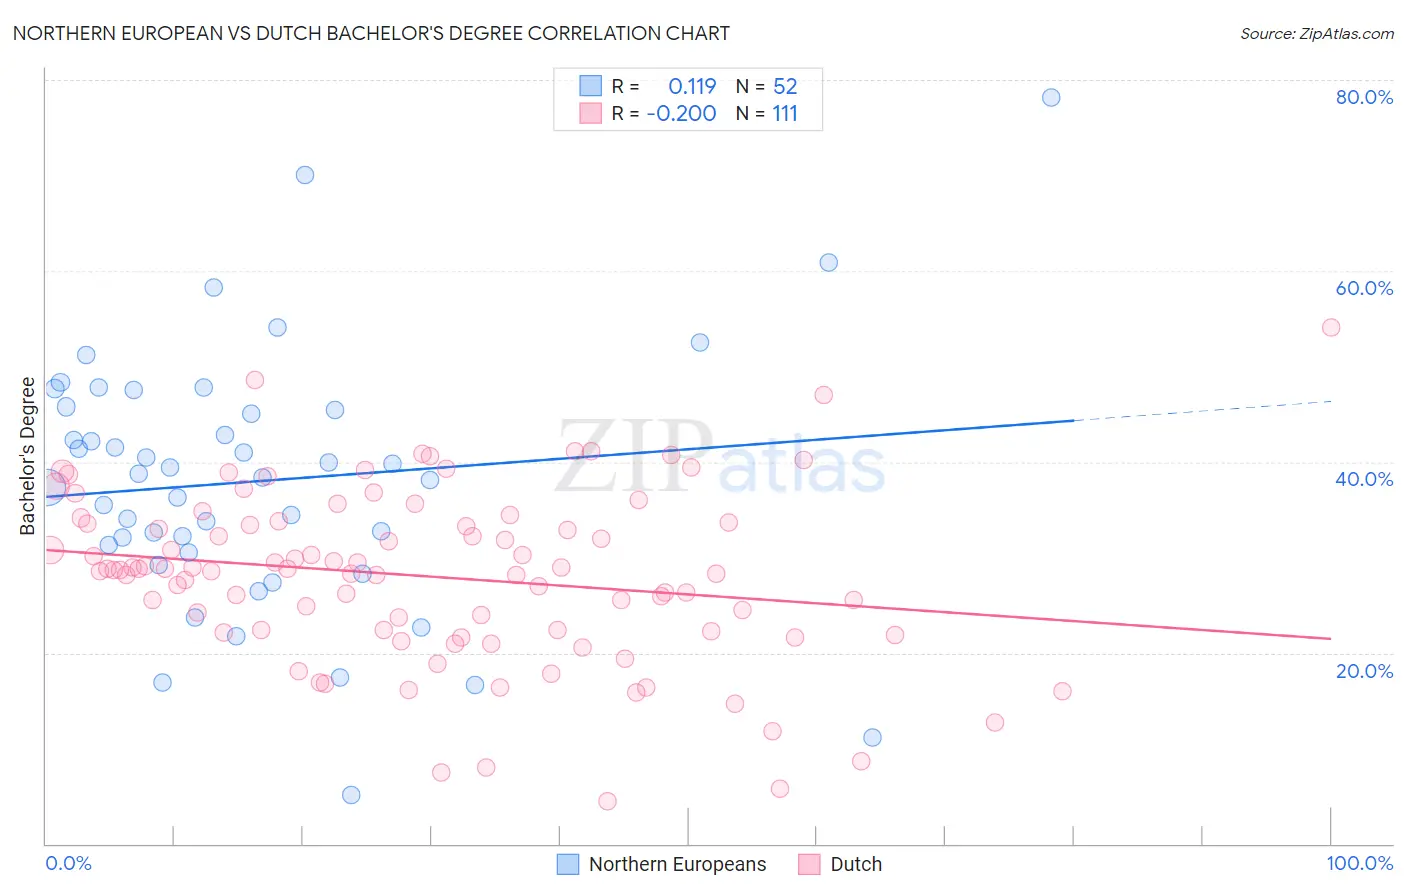
Northern European vs Dutch Bachelor's Degree Correlation Chart
The statistical analysis conducted on geographies consisting of 406,072,770 people shows a poor positive correlation between the proportion of Northern Europeans and percentage of population with at least bachelor's degree education in the United States with a correlation coefficient (R) of 0.119 and weighted average of 41.0%. Similarly, the statistical analysis conducted on geographies consisting of 554,248,334 people shows a weak negative correlation between the proportion of Dutch and percentage of population with at least bachelor's degree education in the United States with a correlation coefficient (R) of -0.200 and weighted average of 35.7%, a difference of 14.7%.
Bachelor's Degree Correlation Summary
| Measurement | Northern European | Dutch |
| Minimum | 5.1% | 4.5% |
| Maximum | 78.2% | 54.1% |
| Range | 73.1% | 49.5% |
| Mean | 38.0% | 28.0% |
| Median | 38.6% | 28.7% |
| Interquartile 25% (IQ1) | 30.9% | 22.2% |
| Interquartile 75% (IQ3) | 45.6% | 33.7% |
| Interquartile Range (IQR) | 14.7% | 11.4% |
| Standard Deviation (Sample) | 13.7% | 9.1% |
| Standard Deviation (Population) | 13.5% | 9.0% |
Similar Demographics by Bachelor's Degree
Demographics Similar to Northern Europeans by Bachelor's Degree
In terms of bachelor's degree, the demographic groups most similar to Northern Europeans are Ukrainian (40.9%, a difference of 0.14%), Arab (40.9%, a difference of 0.16%), Alsatian (41.0%, a difference of 0.17%), Albanian (40.9%, a difference of 0.24%), and Immigrants from Chile (40.8%, a difference of 0.28%).
| Demographics | Rating | Rank | Bachelor's Degree |
| Macedonians | 98.1 /100 | #100 | Exceptional 41.4% |
| Immigrants | Morocco | 98.0 /100 | #101 | Exceptional 41.4% |
| Immigrants | Italy | 97.8 /100 | #102 | Exceptional 41.3% |
| Chileans | 97.5 /100 | #103 | Exceptional 41.2% |
| Jordanians | 97.4 /100 | #104 | Exceptional 41.2% |
| Syrians | 97.4 /100 | #105 | Exceptional 41.1% |
| Alsatians | 97.0 /100 | #106 | Exceptional 41.0% |
| Northern Europeans | 96.8 /100 | #107 | Exceptional 41.0% |
| Ukrainians | 96.6 /100 | #108 | Exceptional 40.9% |
| Arabs | 96.6 /100 | #109 | Exceptional 40.9% |
| Albanians | 96.5 /100 | #110 | Exceptional 40.9% |
| Immigrants | Chile | 96.4 /100 | #111 | Exceptional 40.8% |
| Ugandans | 96.3 /100 | #112 | Exceptional 40.8% |
| Brazilians | 96.3 /100 | #113 | Exceptional 40.8% |
| Afghans | 96.2 /100 | #114 | Exceptional 40.8% |
Demographics Similar to Dutch by Bachelor's Degree
In terms of bachelor's degree, the demographic groups most similar to Dutch are Spanish (35.8%, a difference of 0.11%), Trinidadian and Tobagonian (35.7%, a difference of 0.14%), West Indian (35.8%, a difference of 0.15%), Subsaharan African (35.8%, a difference of 0.18%), and German Russian (35.8%, a difference of 0.28%).
| Demographics | Rating | Rank | Bachelor's Degree |
| Germans | 13.9 /100 | #214 | Poor 36.1% |
| Immigrants | Western Africa | 13.8 /100 | #215 | Poor 36.1% |
| Barbadians | 13.5 /100 | #216 | Poor 36.1% |
| German Russians | 10.2 /100 | #217 | Poor 35.8% |
| Sub-Saharan Africans | 9.8 /100 | #218 | Tragic 35.8% |
| West Indians | 9.7 /100 | #219 | Tragic 35.8% |
| Spanish | 9.6 /100 | #220 | Tragic 35.8% |
| Dutch | 9.2 /100 | #221 | Tragic 35.7% |
| Trinidadians and Tobagonians | 8.8 /100 | #222 | Tragic 35.7% |
| French Canadians | 8.3 /100 | #223 | Tragic 35.6% |
| Immigrants | Barbados | 7.5 /100 | #224 | Tragic 35.5% |
| Immigrants | Burma/Myanmar | 7.3 /100 | #225 | Tragic 35.5% |
| Portuguese | 7.2 /100 | #226 | Tragic 35.5% |
| Ecuadorians | 6.6 /100 | #227 | Tragic 35.4% |
| Immigrants | Trinidad and Tobago | 6.0 /100 | #228 | Tragic 35.3% |