Native Hawaiian vs Indian (Asian) 12th Grade, No Diploma

COMPARE

Native Hawaiian
Race
Ancestry
AfghanAfricanAlaska NativeAlaskan AthabascanAlbanianAleutAlsatianAmericanApacheArabArapahoArgentineanArmenianAssyrian/Chaldean/SyriacAustralianAustrianBahamianBangladeshiBarbadianBasqueBelgianBelizeanBermudanBhutaneseBlackfeetBolivianBrazilianBritishBritish West IndianBulgarianBurmeseCajunCambodianCanadianCape VerdeanCarpatho RusynCelticCentral AmericanCentral American IndianCherokeeCheyenneChickasawChileanChineseChippewaChoctawColombianColvilleComancheCosta RicanCreeCreekCroatianCrowCubanCypriotCzechCzechoslovakianDanishDelawareDominicanDutchDutch West IndianEastern EuropeanEcuadorianEgyptianEnglishEstonianEthiopianEuropeanFijianFilipinoFinnishFrenchFrench American IndianFrench CanadianGermanGerman RussianGhanaianGreekGuamanian/ChamorroGuatemalanGuyaneseHaitianHmongHonduranHopiHoumaHungarianIcelanderIndonesianInupiatIranianIraqiIrishIroquoisIsraeliItalianJamaicanJapaneseJordanianKenyanKiowaKoreanLaotianLatvianLebaneseLiberianLithuanianLumbeeLuxembourgerMacedonianMalaysianMalteseMarshalleseMenomineeMexicanMexican American IndianMongolianMoroccanNative HawaiianNavajoNepaleseNew ZealanderNicaraguanNigerianNorthern EuropeanNorwegianOkinawanOsageOttawaPaiutePakistaniPalestinianPanamanianParaguayanPennsylvania GermanPeruvianPimaPolishPortuguesePotawatomiPuebloPuerto RicanPuget Sound SalishRomanianRussianSalvadoranSamoanScandinavianScotch-IrishScottishSeminoleSenegaleseSerbianShoshoneSierra LeoneanSiouxSlavicSlovakSloveneSomaliSouth AfricanSouth AmericanSouth American IndianSoviet UnionSpaniardSpanishSpanish AmericanSpanish American IndianSri LankanSubsaharan AfricanSudaneseSwedishSwissSyrianTaiwaneseThaiTlingit-HaidaTohono O'OdhamTonganTrinidadian and TobagonianTsimshianTurkishU.S. Virgin IslanderUgandanUkrainianUruguayanUteVenezuelanVietnameseWelshWest IndianYakamaYaquiYugoslavianYumanYup'ikZimbabwean
Immigration
NonimmigrantsImmigrantsAfghanistanAfricaAlbaniaArgentinaArmeniaAsiaAustraliaAustriaBahamasBangladeshBarbadosBelarusBelgiumBelizeBoliviaBosnia and HerzegovinaBrazilBulgariaBurma/MyanmarCabo VerdeCambodiaCameroonCanadaCaribbeanCentral AmericaChileChinaColombiaCongoCosta RicaCroatiaCubaCzechoslovakiaDenmarkDominicaDominican RepublicEastern AfricaEastern AsiaEastern EuropeEcuadorEgyptEl SalvadorEnglandEritreaEthiopiaEuropeFijiFranceGermanyGhanaGreeceGrenadaGuatemalaGuyanaHaitiHondurasHong KongHungaryIndiaIndonesiaIranIraqIrelandIsraelItalyJamaicaJapanJordanKazakhstanKenyaKoreaKuwaitLaosLatin AmericaLatviaLebanonLiberiaLithuaniaMalaysiaMexicoMicronesiaMiddle AfricaMoldovaMoroccoNepalNetherlandsNicaraguaNigeriaNorth AmericaNorth MacedoniaNorthern AfricaNorthern EuropeNorwayOceaniaPakistanPanamaPeruPhilippinesPolandPortugalRomaniaRussiaSaudi ArabiaScotlandSenegalSerbiaSierra LeoneSingaporeSomaliaSouth AfricaSouth AmericaSouth Central AsiaSouth Eastern AsiaSouthern EuropeSpainSri LankaSt. Vincent and the GrenadinesSudanSwedenSwitzerlandSyriaTaiwanThailandTrinidad and TobagoTurkeyUgandaUkraineUruguayUzbekistanVenezuelaVietnamWest IndiesWestern AfricaWestern AsiaWestern EuropeYemenZaireZimbabweAzores
Indian (Asian)
Race
Ancestry
AfghanAfricanAlaska NativeAlaskan AthabascanAlbanianAleutAlsatianAmericanApacheArabArapahoArgentineanArmenianAssyrian/Chaldean/SyriacAustralianAustrianBahamianBangladeshiBarbadianBasqueBelgianBelizeanBermudanBhutaneseBlackfeetBolivianBrazilianBritishBritish West IndianBulgarianBurmeseCajunCambodianCanadianCape VerdeanCarpatho RusynCelticCentral AmericanCentral American IndianCherokeeCheyenneChickasawChileanChineseChippewaChoctawColombianColvilleComancheCosta RicanCreeCreekCroatianCrowCubanCypriotCzechCzechoslovakianDanishDelawareDominicanDutchDutch West IndianEastern EuropeanEcuadorianEgyptianEnglishEstonianEthiopianEuropeanFijianFilipinoFinnishFrenchFrench American IndianFrench CanadianGermanGerman RussianGhanaianGreekGuamanian/ChamorroGuatemalanGuyaneseHaitianHmongHonduranHopiHoumaHungarianIcelanderIndian (Asian)IndonesianInupiatIranianIraqiIrishIroquoisIsraeliItalianJamaicanJapaneseJordanianKenyanKiowaKoreanLaotianLatvianLebaneseLiberianLithuanianLumbeeLuxembourgerMacedonianMalaysianMalteseMarshalleseMenomineeMexicanMexican American IndianMongolianMoroccanNavajoNepaleseNew ZealanderNicaraguanNigerianNorthern EuropeanNorwegianOkinawanOsageOttawaPaiutePakistaniPalestinianPanamanianParaguayanPennsylvania GermanPeruvianPimaPolishPortuguesePotawatomiPuebloPuerto RicanPuget Sound SalishRomanianRussianSalvadoranSamoanScandinavianScotch-IrishScottishSeminoleSenegaleseSerbianShoshoneSierra LeoneanSiouxSlavicSlovakSloveneSomaliSouth AfricanSouth AmericanSouth American IndianSoviet UnionSpaniardSpanishSpanish AmericanSpanish American IndianSri LankanSubsaharan AfricanSudaneseSwedishSwissSyrianTaiwaneseThaiTlingit-HaidaTohono O'OdhamTonganTrinidadian and TobagonianTsimshianTurkishU.S. Virgin IslanderUgandanUkrainianUruguayanUteVenezuelanVietnameseWelshWest IndianYakamaYaquiYugoslavianYumanYup'ikZimbabwean
Immigration
NonimmigrantsImmigrantsAfghanistanAfricaAlbaniaArgentinaArmeniaAsiaAustraliaAustriaBahamasBangladeshBarbadosBelarusBelgiumBelizeBoliviaBosnia and HerzegovinaBrazilBulgariaBurma/MyanmarCabo VerdeCambodiaCameroonCanadaCaribbeanCentral AmericaChileChinaColombiaCongoCosta RicaCroatiaCubaCzechoslovakiaDenmarkDominicaDominican RepublicEastern AfricaEastern AsiaEastern EuropeEcuadorEgyptEl SalvadorEnglandEritreaEthiopiaEuropeFijiFranceGermanyGhanaGreeceGrenadaGuatemalaGuyanaHaitiHondurasHong KongHungaryIndiaIndonesiaIranIraqIrelandIsraelItalyJamaicaJapanJordanKazakhstanKenyaKoreaKuwaitLaosLatin AmericaLatviaLebanonLiberiaLithuaniaMalaysiaMexicoMicronesiaMiddle AfricaMoldovaMoroccoNepalNetherlandsNicaraguaNigeriaNorth AmericaNorth MacedoniaNorthern AfricaNorthern EuropeNorwayOceaniaPakistanPanamaPeruPhilippinesPolandPortugalRomaniaRussiaSaudi ArabiaScotlandSenegalSerbiaSierra LeoneSingaporeSomaliaSouth AfricaSouth AmericaSouth Central AsiaSouth Eastern AsiaSouthern EuropeSpainSri LankaSt. Vincent and the GrenadinesSudanSwedenSwitzerlandSyriaTaiwanThailandTrinidad and TobagoTurkeyUgandaUkraineUruguayUzbekistanVenezuelaVietnamWest IndiesWestern AfricaWestern AsiaWestern EuropeYemenZaireZimbabweAzores
12th Grade, No Diploma
Income
Poverty
Unemployment
Labor Participation
Family Structure
Vehicle Availability
Education Level
Disability

12th Grade, No Diploma Comparison

Native Hawaiians

Indians (Asian)

Exceptional
Good
92.6%
12TH GRADE, NO DIPLOMA
99.4/ 100
METRIC RATING
75th/ 347
METRIC RANK
91.5%
12TH GRADE, NO DIPLOMA
79.4/ 100
METRIC RATING
148th/ 347
METRIC RANK

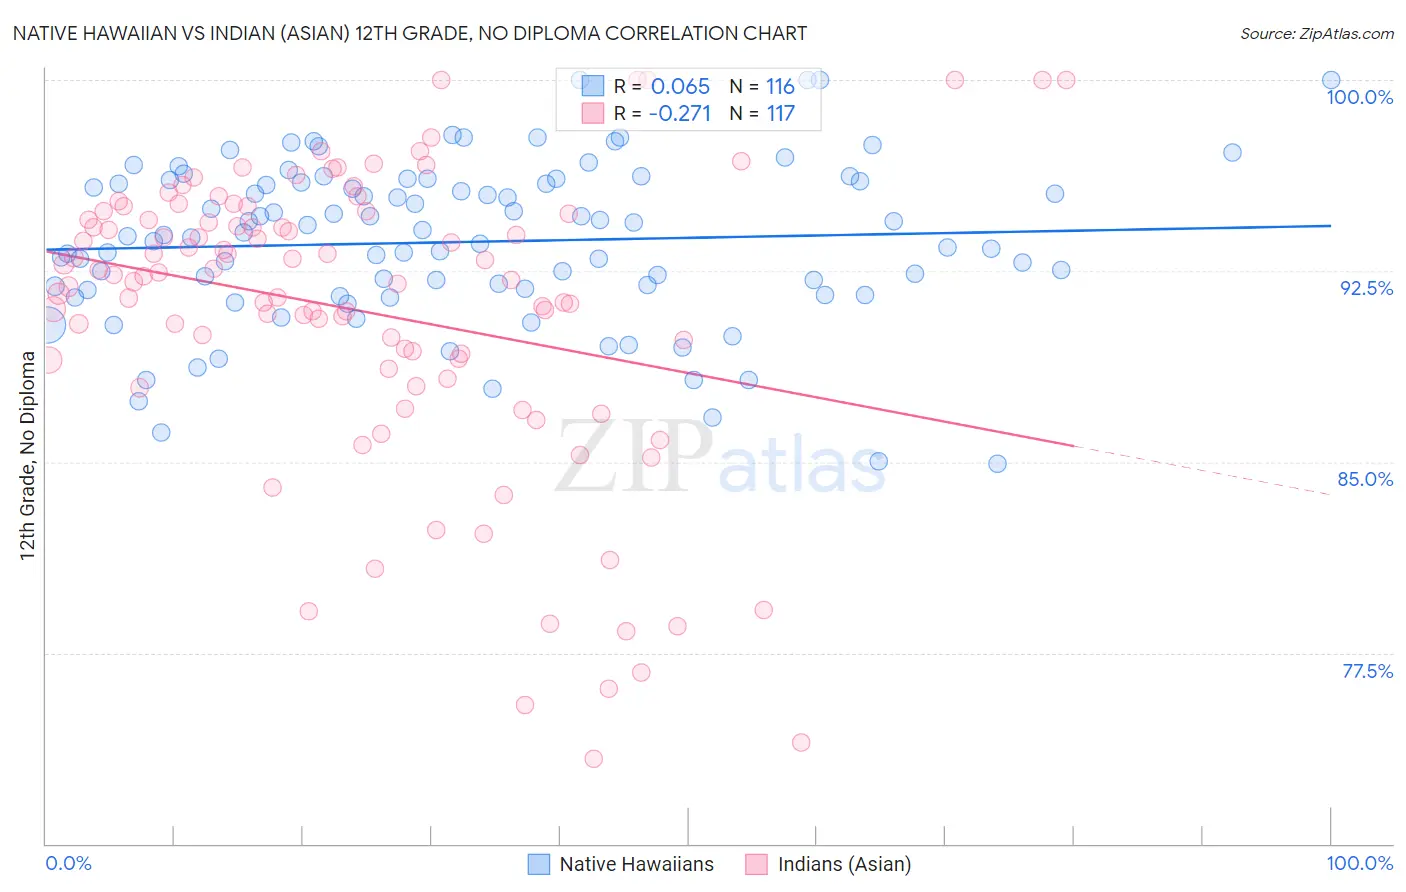
Native Hawaiian vs Indian (Asian) 12th Grade, No Diploma Correlation Chart

The statistical analysis conducted on geographies consisting of 332,119,254 people shows a slight positive correlation between the proportion of Native Hawaiians and percentage of population with at least 12th grade (no diploma) education in the United States with a correlation coefficient (R) of 0.065 and weighted average of 92.6%. Similarly, the statistical analysis conducted on geographies consisting of 495,348,141 people shows a weak negative correlation between the proportion of Indians (Asian) and percentage of population with at least 12th grade (no diploma) education in the United States with a correlation coefficient (R) of -0.271 and weighted average of 91.5%, a difference of 1.2%.
Native Hawaiian vs Indian (Asian) 12th Grade, No Diploma

12th Grade, No Diploma Correlation Summary

MeasurementNative HawaiianIndian (Asian)
Minimum84.9%73.3%
Maximum100.0%100.0%
Range15.1%26.7%
Mean93.6%90.9%
Median93.9%92.3%
Interquartile 25% (IQ1)91.8%88.8%
Interquartile 75% (IQ3)96.0%94.8%
Interquartile Range (IQR)4.2%5.9%
Standard Deviation (Sample)3.2%5.9%
Standard Deviation (Population)3.2%5.9%

Similar Demographics by 12th Grade, No Diploma

Demographics Similar to Native Hawaiians by 12th Grade, No Diploma

In terms of 12th grade, no diploma, the demographic groups most similar to Native Hawaiians are Burmese (92.6%, a difference of 0.0%), Immigrants from Moldova (92.6%, a difference of 0.0%), French (92.6%, a difference of 0.0%), Immigrants from South Central Asia (92.6%, a difference of 0.020%), and Immigrants from England (92.6%, a difference of 0.020%).
DemographicsRating | Rank12th Grade, No Diploma
Immigrants | Czechoslovakia
99.5
/100
|
#68
Exceptional
92.7%
Immigrants | Iran
99.5
/100
|
#69
Exceptional
92.7%
Czechoslovakians
99.5
/100
|
#70
Exceptional
92.6%
Immigrants | Latvia
99.5
/100
|
#71
Exceptional
92.6%
Immigrants | South Central Asia
99.5
/100
|
#72
Exceptional
92.6%
Burmese
99.4
/100
|
#73
Exceptional
92.6%
Immigrants | Moldova
99.4
/100
|
#74
Exceptional
92.6%
Native Hawaiians
99.4
/100
|
#75
Exceptional
92.6%
French
99.4
/100
|
#76
Exceptional
92.6%
Immigrants | England
99.4
/100
|
#77
Exceptional
92.6%
Cambodians
99.3
/100
|
#78
Exceptional
92.6%
Romanians
99.3
/100
|
#79
Exceptional
92.6%
French Canadians
99.3
/100
|
#80
Exceptional
92.6%
Immigrants | Denmark
99.2
/100
|
#81
Exceptional
92.5%
Immigrants | Switzerland
99.2
/100
|
#82
Exceptional
92.5%

Demographics Similar to Indians (Asian) by 12th Grade, No Diploma

In terms of 12th grade, no diploma, the demographic groups most similar to Indians (Asian) are Pakistani (91.5%, a difference of 0.0%), Immigrants from Spain (91.6%, a difference of 0.010%), Immigrants from Lebanon (91.6%, a difference of 0.010%), Immigrants from Brazil (91.5%, a difference of 0.010%), and Ugandan (91.5%, a difference of 0.010%).
DemographicsRating | Rank12th Grade, No Diploma
Argentineans
82.0
/100
|
#141
Excellent
91.6%
Immigrants | Venezuela
80.9
/100
|
#142
Excellent
91.6%
Immigrants | Argentina
80.7
/100
|
#143
Excellent
91.6%
Immigrants | Spain
80.1
/100
|
#144
Excellent
91.6%
Immigrants | Lebanon
80.0
/100
|
#145
Excellent
91.6%
Immigrants | Brazil
79.8
/100
|
#146
Good
91.5%
Pakistanis
79.6
/100
|
#147
Good
91.5%
Indians (Asian)
79.4
/100
|
#148
Good
91.5%
Ugandans
79.0
/100
|
#149
Good
91.5%
Paraguayans
78.9
/100
|
#150
Good
91.5%
Chippewa
78.8
/100
|
#151
Good
91.5%
Kenyans
77.4
/100
|
#152
Good
91.5%
Iraqis
75.3
/100
|
#153
Good
91.5%
Immigrants | Kenya
73.9
/100
|
#154
Good
91.5%
Immigrants | Iraq
73.0
/100
|
#155
Good
91.4%