Native Hawaiian vs Indian (Asian) Child Poverty Under the Age of 16
COMPARE
Native Hawaiian
Indian (Asian)
Child Poverty Under the Age of 16
Child Poverty Under the Age of 16 Comparison
Native Hawaiians
Indians (Asian)
15.2%
CHILD POVERTY UNDER THE AGE OF 16
88.7/ 100
METRIC RATING
134th/ 347
METRIC RANK
13.1%
CHILD POVERTY UNDER THE AGE OF 16
99.8/ 100
METRIC RATING
23rd/ 347
METRIC RANK
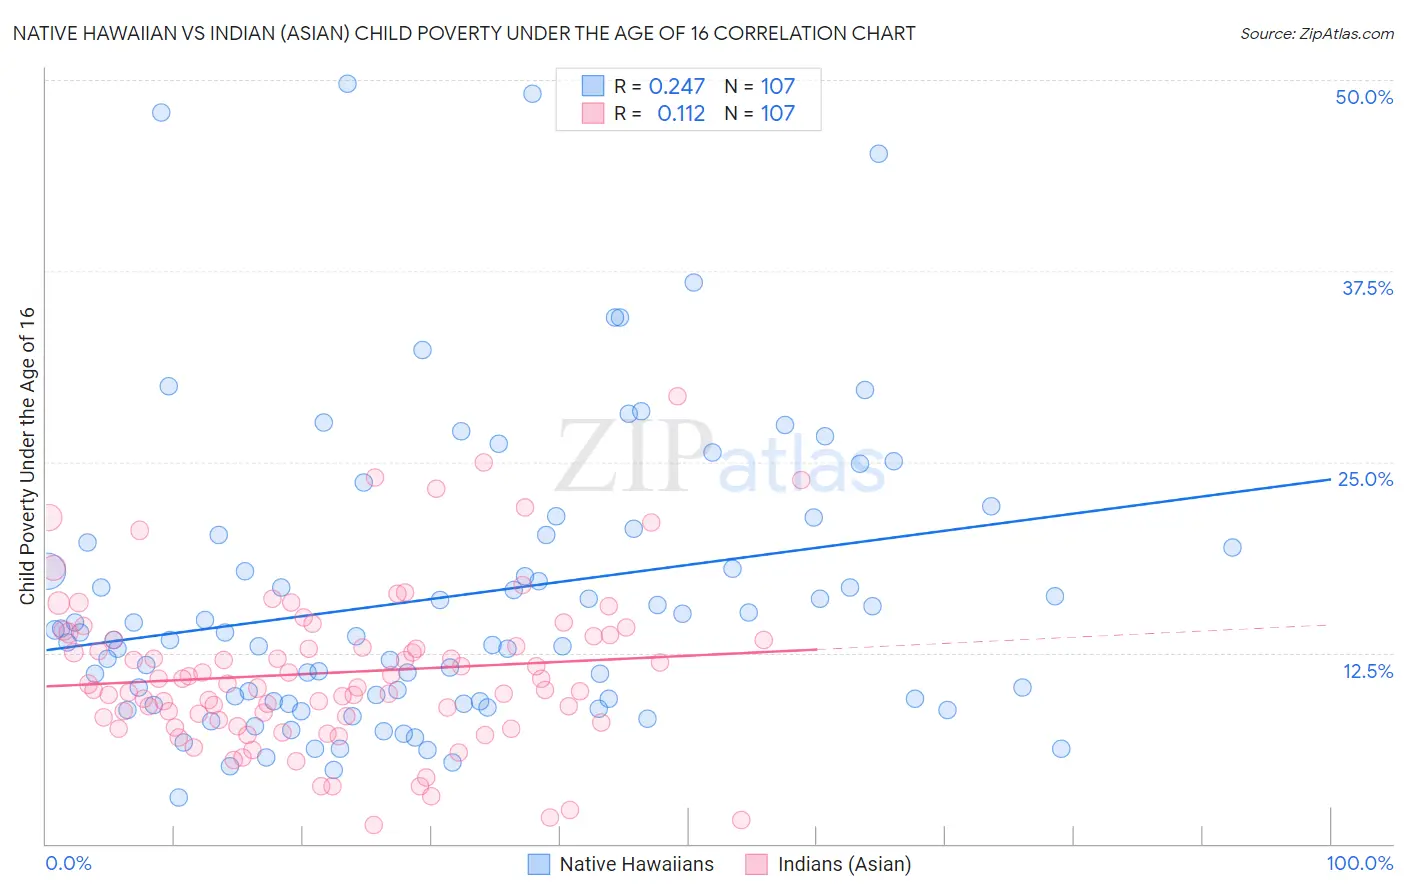
Native Hawaiian vs Indian (Asian) Child Poverty Under the Age of 16 Correlation Chart
The statistical analysis conducted on geographies consisting of 329,952,293 people shows a weak positive correlation between the proportion of Native Hawaiians and poverty level among children under the age of 16 in the United States with a correlation coefficient (R) of 0.247 and weighted average of 15.2%. Similarly, the statistical analysis conducted on geographies consisting of 487,871,555 people shows a poor positive correlation between the proportion of Indians (Asian) and poverty level among children under the age of 16 in the United States with a correlation coefficient (R) of 0.112 and weighted average of 13.1%, a difference of 15.7%.
Child Poverty Under the Age of 16 Correlation Summary
| Measurement | Native Hawaiian | Indian (Asian) |
| Minimum | 3.0% | 1.3% |
| Maximum | 49.7% | 29.3% |
| Range | 46.7% | 28.0% |
| Mean | 16.2% | 11.2% |
| Median | 13.6% | 10.4% |
| Interquartile 25% (IQ1) | 9.3% | 8.1% |
| Interquartile 75% (IQ3) | 20.2% | 13.6% |
| Interquartile Range (IQR) | 10.9% | 5.5% |
| Standard Deviation (Sample) | 9.7% | 5.2% |
| Standard Deviation (Population) | 9.7% | 5.1% |
Similar Demographics by Child Poverty Under the Age of 16
Demographics Similar to Native Hawaiians by Child Poverty Under the Age of 16
In terms of child poverty under the age of 16, the demographic groups most similar to Native Hawaiians are Albanian (15.2%, a difference of 0.040%), Immigrants from South Eastern Asia (15.2%, a difference of 0.090%), Canadian (15.2%, a difference of 0.14%), Armenian (15.2%, a difference of 0.23%), and Mongolian (15.2%, a difference of 0.26%).
| Demographics | Rating | Rank | Child Poverty Under the Age of 16 |
| Immigrants | Western Europe | 90.3 /100 | #127 | Exceptional 15.1% |
| Immigrants | Kazakhstan | 90.2 /100 | #128 | Exceptional 15.1% |
| Immigrants | Southern Europe | 89.7 /100 | #129 | Excellent 15.1% |
| Mongolians | 89.5 /100 | #130 | Excellent 15.2% |
| Armenians | 89.4 /100 | #131 | Excellent 15.2% |
| Canadians | 89.1 /100 | #132 | Excellent 15.2% |
| Immigrants | South Eastern Asia | 89.0 /100 | #133 | Excellent 15.2% |
| Native Hawaiians | 88.7 /100 | #134 | Excellent 15.2% |
| Albanians | 88.6 /100 | #135 | Excellent 15.2% |
| Immigrants | Spain | 87.3 /100 | #136 | Excellent 15.3% |
| Peruvians | 87.2 /100 | #137 | Excellent 15.3% |
| Welsh | 87.2 /100 | #138 | Excellent 15.3% |
| Immigrants | Vietnam | 87.1 /100 | #139 | Excellent 15.3% |
| New Zealanders | 86.9 /100 | #140 | Excellent 15.3% |
| Slavs | 84.2 /100 | #141 | Excellent 15.4% |
Demographics Similar to Indians (Asian) by Child Poverty Under the Age of 16
In terms of child poverty under the age of 16, the demographic groups most similar to Indians (Asian) are Maltese (13.1%, a difference of 0.040%), Immigrants from Eastern Asia (13.1%, a difference of 0.12%), Okinawan (13.1%, a difference of 0.15%), Latvian (13.2%, a difference of 0.21%), and Eastern European (13.2%, a difference of 0.29%).
| Demographics | Rating | Rank | Child Poverty Under the Age of 16 |
| Norwegians | 99.9 /100 | #16 | Exceptional 13.0% |
| Bulgarians | 99.9 /100 | #17 | Exceptional 13.0% |
| Cypriots | 99.9 /100 | #18 | Exceptional 13.0% |
| Immigrants | Japan | 99.8 /100 | #19 | Exceptional 13.0% |
| Okinawans | 99.8 /100 | #20 | Exceptional 13.1% |
| Immigrants | Eastern Asia | 99.8 /100 | #21 | Exceptional 13.1% |
| Maltese | 99.8 /100 | #22 | Exceptional 13.1% |
| Indians (Asian) | 99.8 /100 | #23 | Exceptional 13.1% |
| Latvians | 99.8 /100 | #24 | Exceptional 13.2% |
| Eastern Europeans | 99.8 /100 | #25 | Exceptional 13.2% |
| Bolivians | 99.8 /100 | #26 | Exceptional 13.2% |
| Immigrants | China | 99.8 /100 | #27 | Exceptional 13.3% |
| Assyrians/Chaldeans/Syriacs | 99.7 /100 | #28 | Exceptional 13.3% |
| Swedes | 99.7 /100 | #29 | Exceptional 13.3% |
| Turks | 99.7 /100 | #30 | Exceptional 13.4% |