Native Hawaiian vs Immigrants from Kenya Professional Degree
COMPARE
Native Hawaiian
Immigrants from Kenya
Professional Degree
Professional Degree Comparison
Native Hawaiians
Immigrants from Kenya
3.8%
PROFESSIONAL DEGREE
2.3/ 100
METRIC RATING
242nd/ 347
METRIC RANK
4.4%
PROFESSIONAL DEGREE
45.9/ 100
METRIC RATING
179th/ 347
METRIC RANK
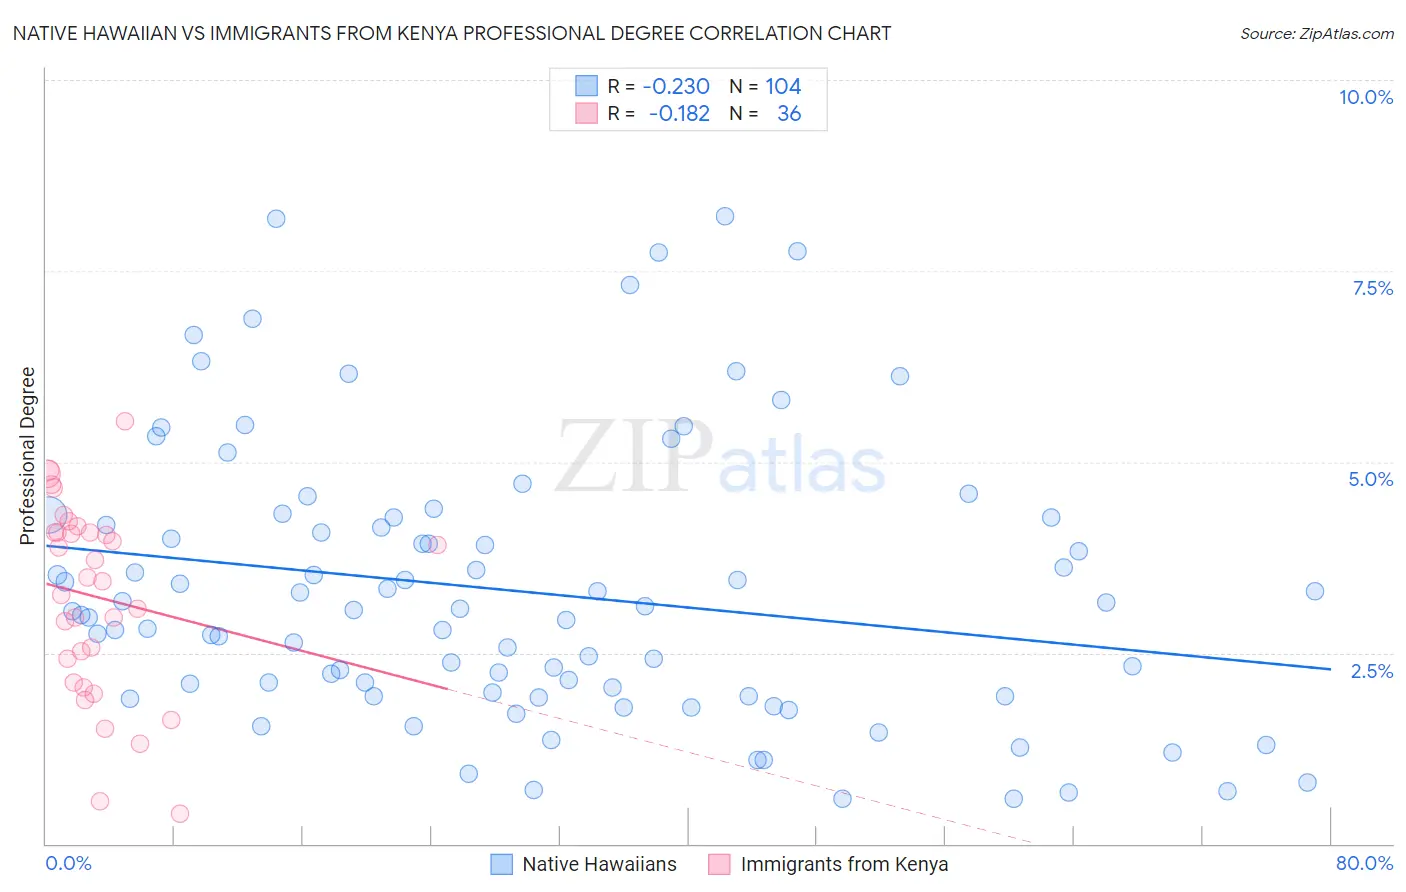
Native Hawaiian vs Immigrants from Kenya Professional Degree Correlation Chart
The statistical analysis conducted on geographies consisting of 331,121,710 people shows a weak negative correlation between the proportion of Native Hawaiians and percentage of population with at least professional degree education in the United States with a correlation coefficient (R) of -0.230 and weighted average of 3.8%. Similarly, the statistical analysis conducted on geographies consisting of 217,865,757 people shows a poor negative correlation between the proportion of Immigrants from Kenya and percentage of population with at least professional degree education in the United States with a correlation coefficient (R) of -0.182 and weighted average of 4.4%, a difference of 15.1%.
Professional Degree Correlation Summary
| Measurement | Native Hawaiian | Immigrants from Kenya |
| Minimum | 0.59% | 0.40% |
| Maximum | 8.2% | 5.5% |
| Range | 7.6% | 5.1% |
| Mean | 3.3% | 3.2% |
| Median | 3.0% | 3.5% |
| Interquartile 25% (IQ1) | 2.0% | 2.3% |
| Interquartile 75% (IQ3) | 4.2% | 4.1% |
| Interquartile Range (IQR) | 2.3% | 1.8% |
| Standard Deviation (Sample) | 1.8% | 1.3% |
| Standard Deviation (Population) | 1.8% | 1.2% |
Similar Demographics by Professional Degree
Demographics Similar to Native Hawaiians by Professional Degree
In terms of professional degree, the demographic groups most similar to Native Hawaiians are Alaskan Athabascan (3.8%, a difference of 0.0%), Immigrants from Ecuador (3.8%, a difference of 0.020%), Guamanian/Chamorro (3.8%, a difference of 0.080%), British West Indian (3.8%, a difference of 0.25%), and Immigrants from Bahamas (3.8%, a difference of 0.51%).
| Demographics | Rating | Rank | Professional Degree |
| Immigrants | Barbados | 4.0 /100 | #235 | Tragic 3.9% |
| Spanish Americans | 3.8 /100 | #236 | Tragic 3.9% |
| Immigrants | Trinidad and Tobago | 3.8 /100 | #237 | Tragic 3.9% |
| Colville | 2.6 /100 | #238 | Tragic 3.8% |
| British West Indians | 2.4 /100 | #239 | Tragic 3.8% |
| Immigrants | Ecuador | 2.3 /100 | #240 | Tragic 3.8% |
| Alaskan Athabascans | 2.3 /100 | #241 | Tragic 3.8% |
| Native Hawaiians | 2.3 /100 | #242 | Tragic 3.8% |
| Guamanians/Chamorros | 2.2 /100 | #243 | Tragic 3.8% |
| Immigrants | Bahamas | 2.0 /100 | #244 | Tragic 3.8% |
| French American Indians | 1.7 /100 | #245 | Tragic 3.8% |
| Marshallese | 1.7 /100 | #246 | Tragic 3.8% |
| Guyanese | 1.6 /100 | #247 | Tragic 3.8% |
| Hmong | 1.6 /100 | #248 | Tragic 3.7% |
| Immigrants | Grenada | 1.5 /100 | #249 | Tragic 3.7% |
Demographics Similar to Immigrants from Kenya by Professional Degree
In terms of professional degree, the demographic groups most similar to Immigrants from Kenya are Immigrants from Costa Rica (4.4%, a difference of 0.11%), Czech (4.4%, a difference of 0.15%), Celtic (4.4%, a difference of 0.24%), Danish (4.4%, a difference of 0.36%), and Immigrants (4.4%, a difference of 0.41%).
| Demographics | Rating | Rank | Professional Degree |
| Spaniards | 52.0 /100 | #172 | Average 4.4% |
| English | 50.1 /100 | #173 | Average 4.4% |
| Kenyans | 50.0 /100 | #174 | Average 4.4% |
| Irish | 50.0 /100 | #175 | Average 4.4% |
| Immigrants | Peru | 49.3 /100 | #176 | Average 4.4% |
| Celtics | 47.6 /100 | #177 | Average 4.4% |
| Immigrants | Costa Rica | 46.7 /100 | #178 | Average 4.4% |
| Immigrants | Kenya | 45.9 /100 | #179 | Average 4.4% |
| Czechs | 44.9 /100 | #180 | Average 4.4% |
| Danes | 43.5 /100 | #181 | Average 4.4% |
| Immigrants | Immigrants | 43.2 /100 | #182 | Average 4.4% |
| Bermudans | 43.1 /100 | #183 | Average 4.4% |
| Belgians | 36.2 /100 | #184 | Fair 4.3% |
| Welsh | 35.8 /100 | #185 | Fair 4.3% |
| Scotch-Irish | 34.2 /100 | #186 | Fair 4.3% |