Native Hawaiian vs Immigrants from Kenya 5th Grade
COMPARE
Native Hawaiian
Immigrants from Kenya
5th Grade
5th Grade Comparison
Native Hawaiians
Immigrants from Kenya
98.0%
5TH GRADE
99.9/ 100
METRIC RATING
47th/ 347
METRIC RANK
97.3%
5TH GRADE
40.3/ 100
METRIC RATING
179th/ 347
METRIC RANK
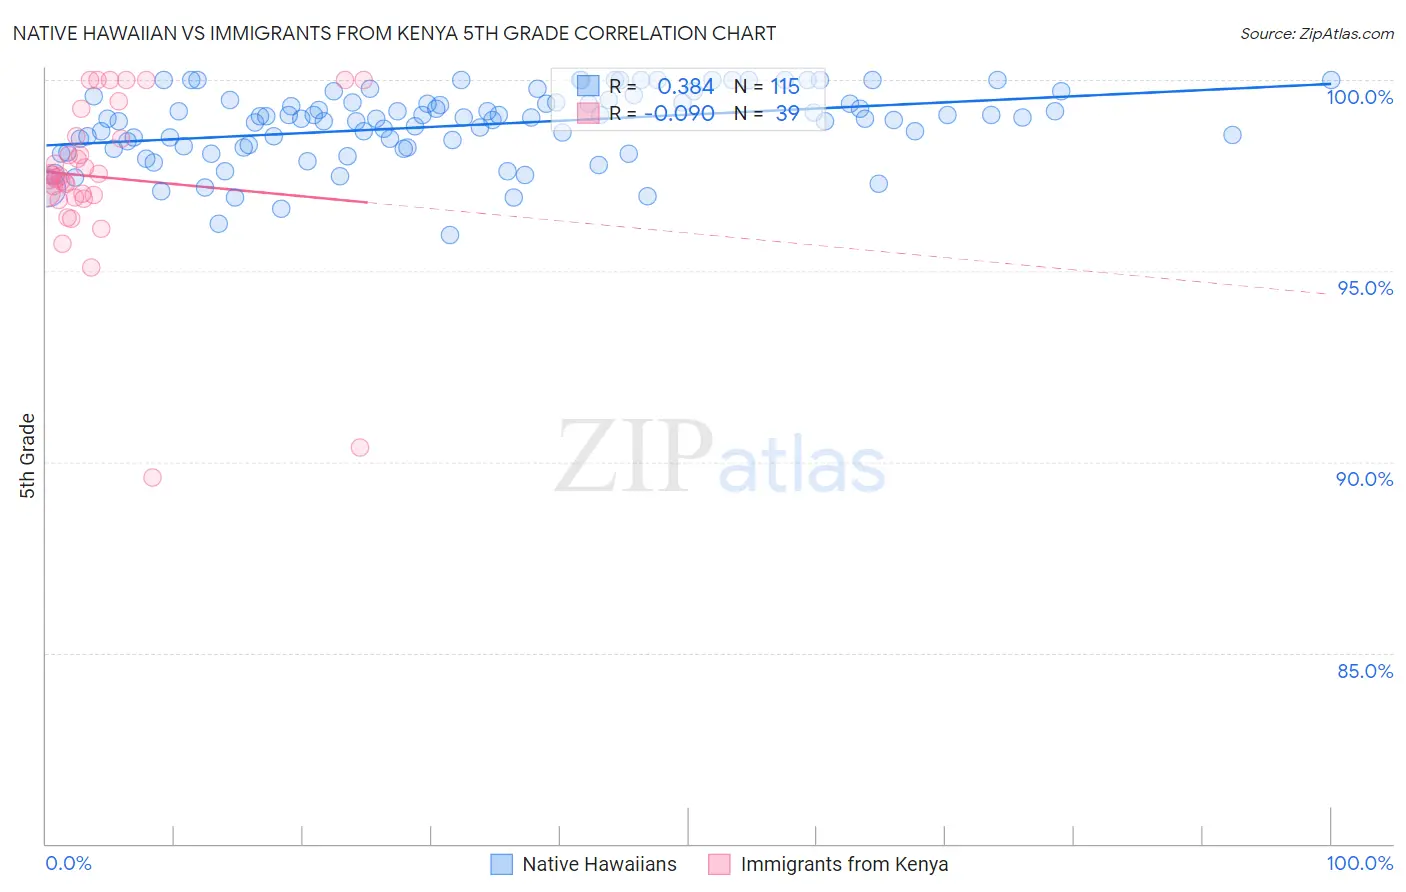
Native Hawaiian vs Immigrants from Kenya 5th Grade Correlation Chart
The statistical analysis conducted on geographies consisting of 332,113,170 people shows a mild positive correlation between the proportion of Native Hawaiians and percentage of population with at least 5th grade education in the United States with a correlation coefficient (R) of 0.384 and weighted average of 98.0%. Similarly, the statistical analysis conducted on geographies consisting of 218,076,690 people shows a slight negative correlation between the proportion of Immigrants from Kenya and percentage of population with at least 5th grade education in the United States with a correlation coefficient (R) of -0.090 and weighted average of 97.3%, a difference of 0.72%.
5th Grade Correlation Summary
| Measurement | Native Hawaiian | Immigrants from Kenya |
| Minimum | 95.9% | 89.6% |
| Maximum | 100.0% | 100.0% |
| Range | 4.1% | 10.4% |
| Mean | 98.8% | 97.5% |
| Median | 99.0% | 97.5% |
| Interquartile 25% (IQ1) | 98.2% | 96.9% |
| Interquartile 75% (IQ3) | 99.4% | 98.5% |
| Interquartile Range (IQR) | 1.2% | 1.6% |
| Standard Deviation (Sample) | 0.93% | 2.2% |
| Standard Deviation (Population) | 0.93% | 2.2% |
Similar Demographics by 5th Grade
Demographics Similar to Native Hawaiians by 5th Grade
In terms of 5th grade, the demographic groups most similar to Native Hawaiians are Czechoslovakian (98.0%, a difference of 0.010%), Arapaho (98.0%, a difference of 0.010%), Bulgarian (98.0%, a difference of 0.010%), Aleut (98.0%, a difference of 0.020%), and Estonian (98.0%, a difference of 0.020%).
| Demographics | Rating | Rank | 5th Grade |
| Eastern Europeans | 99.9 /100 | #40 | Exceptional 98.1% |
| Hungarians | 99.9 /100 | #41 | Exceptional 98.0% |
| Northern Europeans | 99.9 /100 | #42 | Exceptional 98.0% |
| Ottawa | 99.9 /100 | #43 | Exceptional 98.0% |
| Aleuts | 99.9 /100 | #44 | Exceptional 98.0% |
| Czechoslovakians | 99.9 /100 | #45 | Exceptional 98.0% |
| Arapaho | 99.9 /100 | #46 | Exceptional 98.0% |
| Native Hawaiians | 99.9 /100 | #47 | Exceptional 98.0% |
| Bulgarians | 99.8 /100 | #48 | Exceptional 98.0% |
| Estonians | 99.8 /100 | #49 | Exceptional 98.0% |
| Immigrants | Scotland | 99.8 /100 | #50 | Exceptional 98.0% |
| Celtics | 99.8 /100 | #51 | Exceptional 98.0% |
| Maltese | 99.8 /100 | #52 | Exceptional 98.0% |
| Slavs | 99.8 /100 | #53 | Exceptional 98.0% |
| Australians | 99.8 /100 | #54 | Exceptional 98.0% |
Demographics Similar to Immigrants from Kenya by 5th Grade
In terms of 5th grade, the demographic groups most similar to Immigrants from Kenya are Pakistani (97.3%, a difference of 0.0%), Argentinean (97.3%, a difference of 0.0%), Mongolian (97.3%, a difference of 0.0%), Comanche (97.3%, a difference of 0.010%), and Immigrants from Ukraine (97.3%, a difference of 0.010%).
| Demographics | Rating | Rank | 5th Grade |
| Arabs | 53.4 /100 | #172 | Average 97.3% |
| Egyptians | 52.4 /100 | #173 | Average 97.3% |
| Immigrants | Kazakhstan | 50.0 /100 | #174 | Average 97.3% |
| Immigrants | Micronesia | 48.8 /100 | #175 | Average 97.3% |
| Immigrants | Taiwan | 48.4 /100 | #176 | Average 97.3% |
| Immigrants | Spain | 47.0 /100 | #177 | Average 97.3% |
| Comanche | 42.1 /100 | #178 | Average 97.3% |
| Immigrants | Kenya | 40.3 /100 | #179 | Average 97.3% |
| Pakistanis | 40.2 /100 | #180 | Average 97.3% |
| Argentineans | 39.5 /100 | #181 | Fair 97.3% |
| Mongolians | 39.4 /100 | #182 | Fair 97.3% |
| Immigrants | Ukraine | 38.6 /100 | #183 | Fair 97.3% |
| Immigrants | Venezuela | 38.4 /100 | #184 | Fair 97.3% |
| Dutch West Indians | 36.2 /100 | #185 | Fair 97.3% |
| Immigrants | Argentina | 36.1 /100 | #186 | Fair 97.3% |