Pakistani vs Immigrants from Kenya Bachelor's Degree
COMPARE
Pakistani
Immigrants from Kenya
Bachelor's Degree
Bachelor's Degree Comparison
Pakistanis
Immigrants from Kenya
39.7%
BACHELOR'S DEGREE
88.2/ 100
METRIC RATING
136th/ 347
METRIC RANK
38.8%
BACHELOR'S DEGREE
73.8/ 100
METRIC RATING
155th/ 347
METRIC RANK
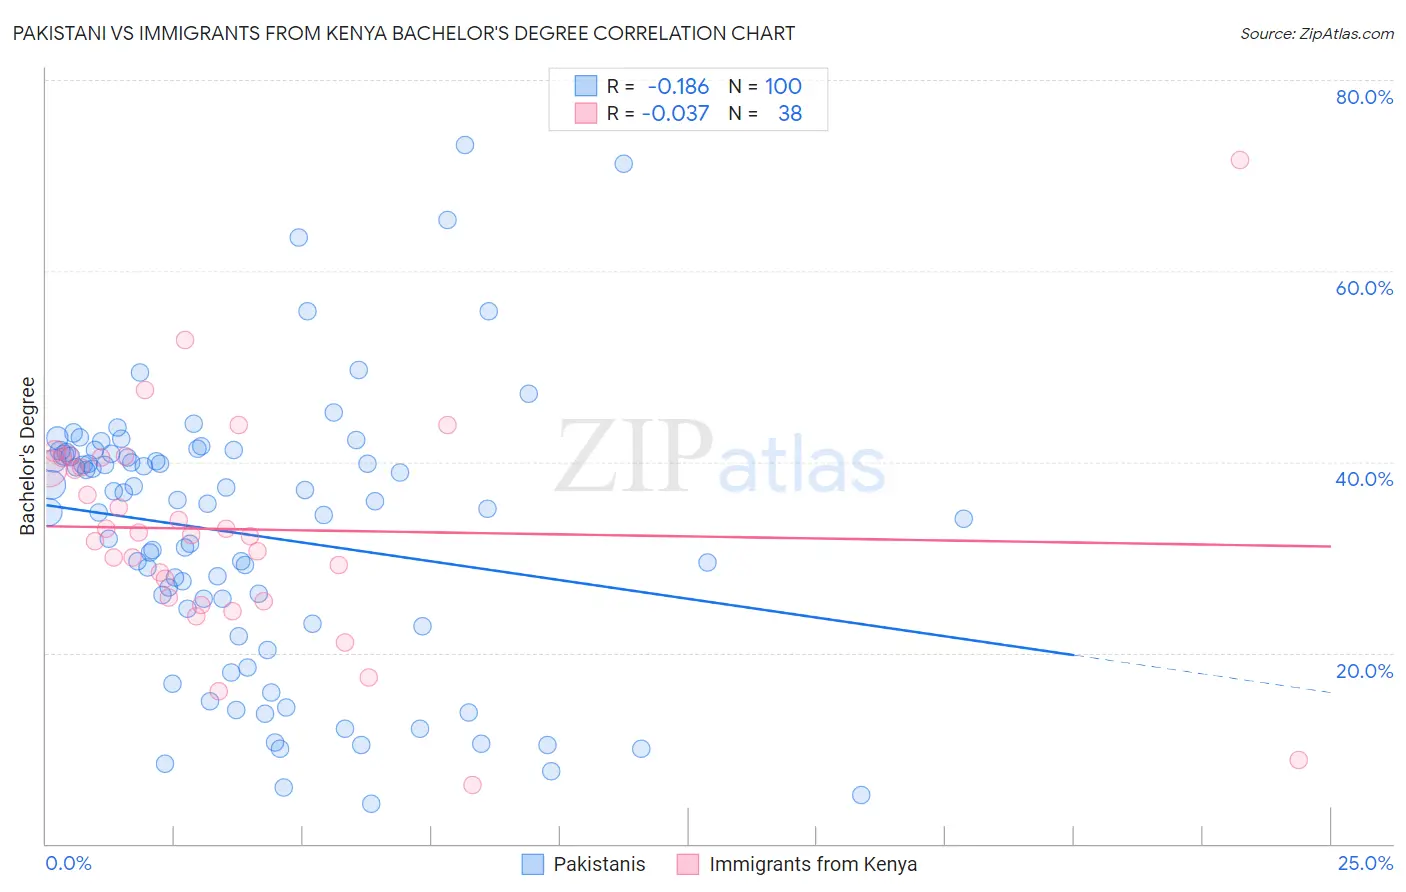
Pakistani vs Immigrants from Kenya Bachelor's Degree Correlation Chart
The statistical analysis conducted on geographies consisting of 335,326,459 people shows a poor negative correlation between the proportion of Pakistanis and percentage of population with at least bachelor's degree education in the United States with a correlation coefficient (R) of -0.186 and weighted average of 39.7%. Similarly, the statistical analysis conducted on geographies consisting of 218,073,270 people shows no correlation between the proportion of Immigrants from Kenya and percentage of population with at least bachelor's degree education in the United States with a correlation coefficient (R) of -0.037 and weighted average of 38.8%, a difference of 2.3%.
Bachelor's Degree Correlation Summary
| Measurement | Pakistani | Immigrants from Kenya |
| Minimum | 4.2% | 6.2% |
| Maximum | 73.2% | 71.6% |
| Range | 69.0% | 65.4% |
| Mean | 32.3% | 32.9% |
| Median | 35.3% | 32.5% |
| Interquartile 25% (IQ1) | 22.9% | 25.8% |
| Interquartile 75% (IQ3) | 40.7% | 40.5% |
| Interquartile Range (IQR) | 17.9% | 14.7% |
| Standard Deviation (Sample) | 14.3% | 11.8% |
| Standard Deviation (Population) | 14.3% | 11.7% |
Demographics Similar to Pakistanis and Immigrants from Kenya by Bachelor's Degree
In terms of bachelor's degree, the demographic groups most similar to Pakistanis are Luxembourger (39.8%, a difference of 0.20%), Icelander (39.5%, a difference of 0.37%), European (39.5%, a difference of 0.54%), Immigrants from Sudan (39.4%, a difference of 0.74%), and Immigrants from Armenia (39.4%, a difference of 0.81%). Similarly, the demographic groups most similar to Immigrants from Kenya are Canadian (38.8%, a difference of 0.15%), Slavic (38.9%, a difference of 0.27%), Sudanese (38.9%, a difference of 0.33%), Immigrants from Africa (38.9%, a difference of 0.35%), and South American (38.9%, a difference of 0.45%).
| Demographics | Rating | Rank | Bachelor's Degree |
| Luxembourgers | 89.1 /100 | #135 | Excellent 39.8% |
| Pakistanis | 88.2 /100 | #136 | Excellent 39.7% |
| Icelanders | 86.5 /100 | #137 | Excellent 39.5% |
| Europeans | 85.6 /100 | #138 | Excellent 39.5% |
| Immigrants | Sudan | 84.5 /100 | #139 | Excellent 39.4% |
| Immigrants | Armenia | 84.1 /100 | #140 | Excellent 39.4% |
| South American Indians | 83.6 /100 | #141 | Excellent 39.3% |
| Immigrants | North Macedonia | 81.6 /100 | #142 | Excellent 39.2% |
| Poles | 79.8 /100 | #143 | Good 39.1% |
| Immigrants | Afghanistan | 79.7 /100 | #144 | Good 39.1% |
| Slovenes | 79.5 /100 | #145 | Good 39.1% |
| Swedes | 79.2 /100 | #146 | Good 39.1% |
| Immigrants | Sierra Leone | 79.0 /100 | #147 | Good 39.0% |
| Iraqis | 78.1 /100 | #148 | Good 39.0% |
| Immigrants | Poland | 77.5 /100 | #149 | Good 39.0% |
| South Americans | 77.3 /100 | #150 | Good 38.9% |
| Immigrants | Africa | 76.5 /100 | #151 | Good 38.9% |
| Sudanese | 76.4 /100 | #152 | Good 38.9% |
| Slavs | 75.9 /100 | #153 | Good 38.9% |
| Canadians | 75.0 /100 | #154 | Good 38.8% |
| Immigrants | Kenya | 73.8 /100 | #155 | Good 38.8% |