Immigrants from Northern Europe vs Sudanese Doctorate Degree
COMPARE
Immigrants from Northern Europe
Sudanese
Doctorate Degree
Doctorate Degree Comparison
Immigrants from Northern Europe
Sudanese
2.6%
DOCTORATE DEGREE
100.0/ 100
METRIC RATING
32nd/ 347
METRIC RANK
2.1%
DOCTORATE DEGREE
97.7/ 100
METRIC RATING
106th/ 347
METRIC RANK
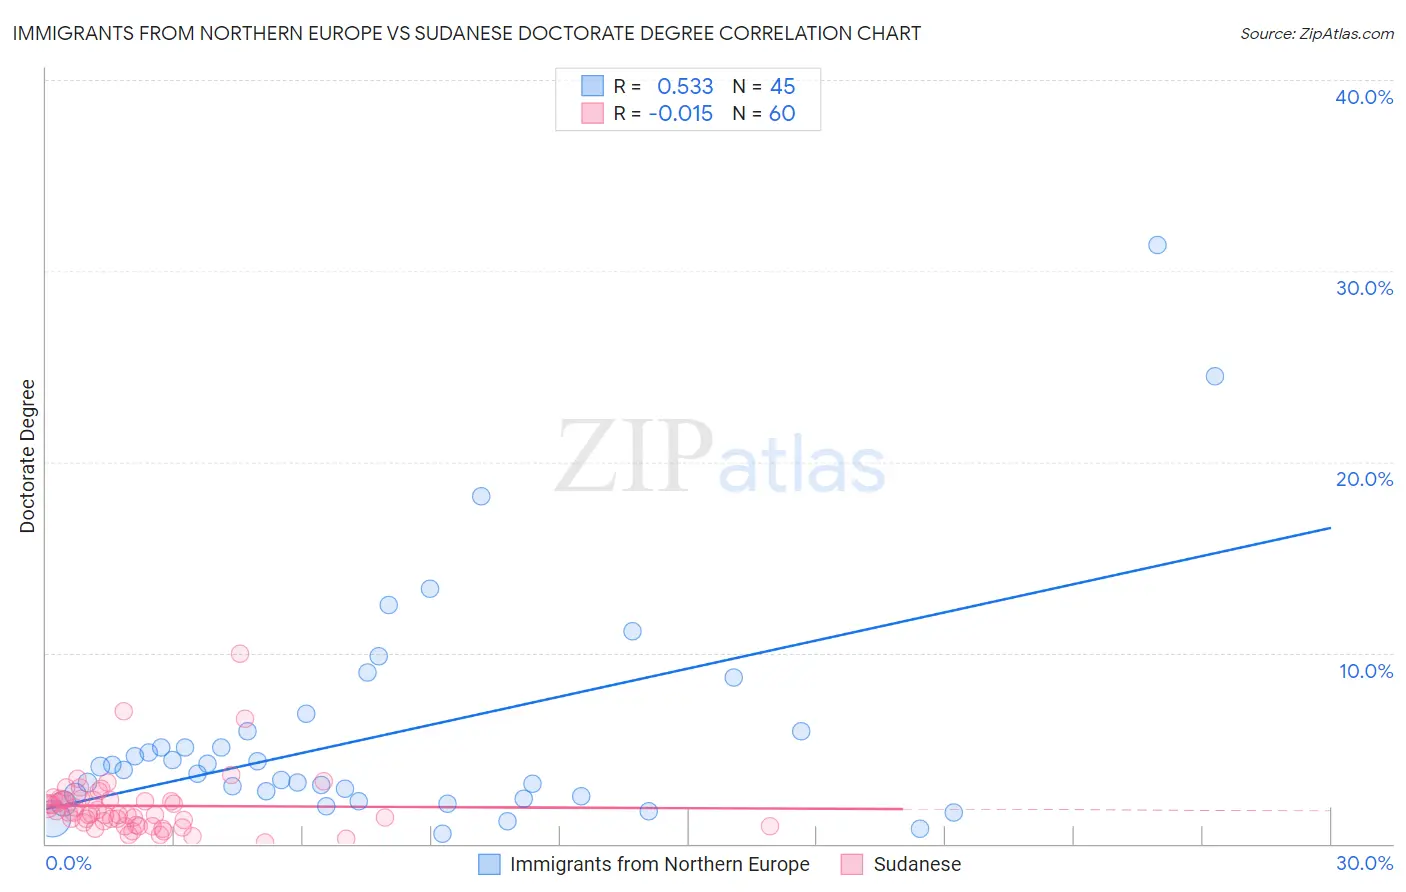
Immigrants from Northern Europe vs Sudanese Doctorate Degree Correlation Chart
The statistical analysis conducted on geographies consisting of 470,866,361 people shows a substantial positive correlation between the proportion of Immigrants from Northern Europe and percentage of population with at least doctorate degree education in the United States with a correlation coefficient (R) of 0.533 and weighted average of 2.6%. Similarly, the statistical analysis conducted on geographies consisting of 109,863,748 people shows no correlation between the proportion of Sudanese and percentage of population with at least doctorate degree education in the United States with a correlation coefficient (R) of -0.015 and weighted average of 2.1%, a difference of 22.9%.
Doctorate Degree Correlation Summary
| Measurement | Immigrants from Northern Europe | Sudanese |
| Minimum | 0.53% | 0.038% |
| Maximum | 31.4% | 9.9% |
| Range | 30.8% | 9.9% |
| Mean | 5.7% | 2.0% |
| Median | 3.9% | 1.6% |
| Interquartile 25% (IQ1) | 2.4% | 1.1% |
| Interquartile 75% (IQ3) | 5.9% | 2.3% |
| Interquartile Range (IQR) | 3.4% | 1.2% |
| Standard Deviation (Sample) | 6.1% | 1.6% |
| Standard Deviation (Population) | 6.0% | 1.6% |
Similar Demographics by Doctorate Degree
Demographics Similar to Immigrants from Northern Europe by Doctorate Degree
In terms of doctorate degree, the demographic groups most similar to Immigrants from Northern Europe are Latvian (2.6%, a difference of 0.15%), Cambodian (2.6%, a difference of 0.17%), Cypriot (2.6%, a difference of 0.29%), Immigrants from Malaysia (2.6%, a difference of 0.35%), and Immigrants from Spain (2.6%, a difference of 0.41%).
| Demographics | Rating | Rank | Doctorate Degree |
| Immigrants | Saudi Arabia | 100.0 /100 | #25 | Exceptional 2.7% |
| Turks | 100.0 /100 | #26 | Exceptional 2.7% |
| Immigrants | Turkey | 100.0 /100 | #27 | Exceptional 2.6% |
| Burmese | 100.0 /100 | #28 | Exceptional 2.6% |
| Immigrants | South Central Asia | 100.0 /100 | #29 | Exceptional 2.6% |
| Immigrants | Korea | 100.0 /100 | #30 | Exceptional 2.6% |
| Latvians | 100.0 /100 | #31 | Exceptional 2.6% |
| Immigrants | Northern Europe | 100.0 /100 | #32 | Exceptional 2.6% |
| Cambodians | 100.0 /100 | #33 | Exceptional 2.6% |
| Cypriots | 100.0 /100 | #34 | Exceptional 2.6% |
| Immigrants | Malaysia | 100.0 /100 | #35 | Exceptional 2.6% |
| Immigrants | Spain | 100.0 /100 | #36 | Exceptional 2.6% |
| Immigrants | Kuwait | 100.0 /100 | #37 | Exceptional 2.6% |
| Russians | 100.0 /100 | #38 | Exceptional 2.6% |
| Immigrants | Ireland | 100.0 /100 | #39 | Exceptional 2.5% |
Demographics Similar to Sudanese by Doctorate Degree
In terms of doctorate degree, the demographic groups most similar to Sudanese are Arab (2.1%, a difference of 0.10%), European (2.1%, a difference of 0.39%), Austrian (2.1%, a difference of 0.45%), Romanian (2.1%, a difference of 0.57%), and Immigrants from Chile (2.1%, a difference of 0.58%).
| Demographics | Rating | Rank | Doctorate Degree |
| Immigrants | Egypt | 98.2 /100 | #99 | Exceptional 2.1% |
| Immigrants | Eastern Europe | 98.2 /100 | #100 | Exceptional 2.1% |
| Immigrants | Eastern Africa | 98.2 /100 | #101 | Exceptional 2.1% |
| Immigrants | Chile | 98.1 /100 | #102 | Exceptional 2.1% |
| Romanians | 98.1 /100 | #103 | Exceptional 2.1% |
| Austrians | 98.0 /100 | #104 | Exceptional 2.1% |
| Arabs | 97.8 /100 | #105 | Exceptional 2.1% |
| Sudanese | 97.7 /100 | #106 | Exceptional 2.1% |
| Europeans | 97.5 /100 | #107 | Exceptional 2.1% |
| Immigrants | Germany | 97.3 /100 | #108 | Exceptional 2.1% |
| Ukrainians | 97.2 /100 | #109 | Exceptional 2.1% |
| Brazilians | 97.2 /100 | #110 | Exceptional 2.1% |
| Immigrants | Pakistan | 97.1 /100 | #111 | Exceptional 2.1% |
| Syrians | 97.1 /100 | #112 | Exceptional 2.1% |
| Immigrants | Italy | 96.9 /100 | #113 | Exceptional 2.1% |