Moroccan vs Marshallese Nursery School
COMPARE
Moroccan
Marshallese
Nursery School
Nursery School Comparison
Moroccans
Marshallese
97.8%
NURSERY SCHOOL
8.3/ 100
METRIC RATING
213th/ 347
METRIC RANK
98.1%
NURSERY SCHOOL
81.2/ 100
METRIC RATING
143rd/ 347
METRIC RANK
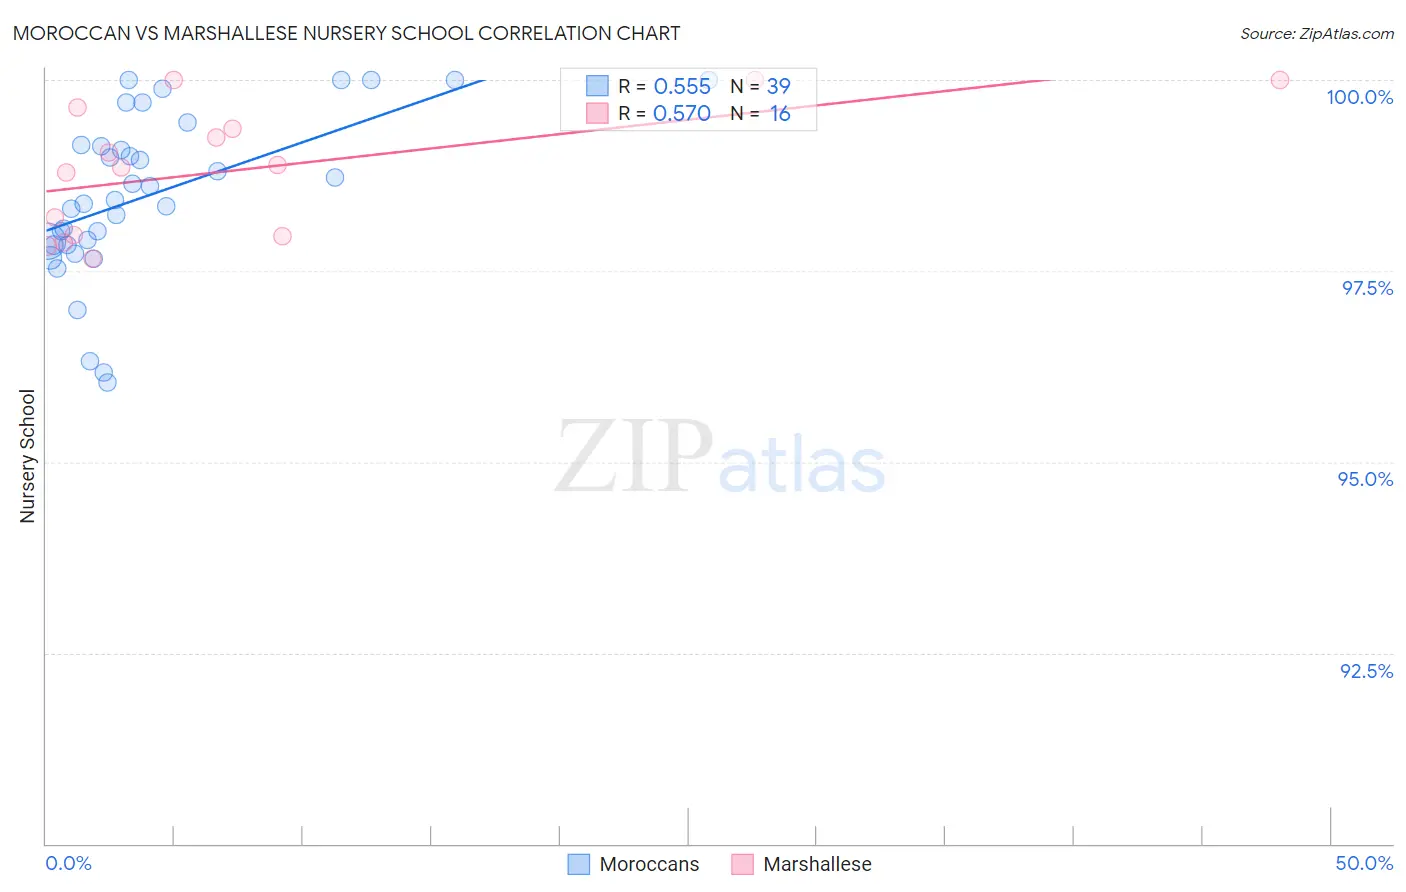
Moroccan vs Marshallese Nursery School Correlation Chart
The statistical analysis conducted on geographies consisting of 201,817,667 people shows a substantial positive correlation between the proportion of Moroccans and percentage of population with at least nursery school education in the United States with a correlation coefficient (R) of 0.555 and weighted average of 97.8%. Similarly, the statistical analysis conducted on geographies consisting of 14,761,315 people shows a substantial positive correlation between the proportion of Marshallese and percentage of population with at least nursery school education in the United States with a correlation coefficient (R) of 0.570 and weighted average of 98.1%, a difference of 0.29%.
Nursery School Correlation Summary
| Measurement | Moroccan | Marshallese |
| Minimum | 96.0% | 97.7% |
| Maximum | 100.0% | 100.0% |
| Range | 4.0% | 2.3% |
| Mean | 98.5% | 98.8% |
| Median | 98.4% | 98.9% |
| Interquartile 25% (IQ1) | 97.8% | 98.0% |
| Interquartile 75% (IQ3) | 99.1% | 99.5% |
| Interquartile Range (IQR) | 1.3% | 1.5% |
| Standard Deviation (Sample) | 1.1% | 0.84% |
| Standard Deviation (Population) | 1.0% | 0.81% |
Similar Demographics by Nursery School
Demographics Similar to Moroccans by Nursery School
In terms of nursery school, the demographic groups most similar to Moroccans are Immigrants from Bahamas (97.8%, a difference of 0.0%), South American Indian (97.8%, a difference of 0.0%), Laotian (97.8%, a difference of 0.010%), Bahamian (97.8%, a difference of 0.010%), and Uruguayan (97.8%, a difference of 0.010%).
| Demographics | Rating | Rank | Nursery School |
| Immigrants | Albania | 16.4 /100 | #206 | Poor 97.9% |
| Africans | 15.4 /100 | #207 | Poor 97.9% |
| Immigrants | Northern Africa | 11.7 /100 | #208 | Poor 97.8% |
| Costa Ricans | 11.3 /100 | #209 | Poor 97.8% |
| Immigrants | Oceania | 10.2 /100 | #210 | Poor 97.8% |
| Laotians | 9.8 /100 | #211 | Tragic 97.8% |
| Immigrants | Bahamas | 8.6 /100 | #212 | Tragic 97.8% |
| Moroccans | 8.3 /100 | #213 | Tragic 97.8% |
| South American Indians | 8.0 /100 | #214 | Tragic 97.8% |
| Bahamians | 7.4 /100 | #215 | Tragic 97.8% |
| Uruguayans | 7.1 /100 | #216 | Tragic 97.8% |
| Samoans | 6.3 /100 | #217 | Tragic 97.8% |
| Immigrants | Panama | 5.3 /100 | #218 | Tragic 97.8% |
| Immigrants | Morocco | 5.1 /100 | #219 | Tragic 97.8% |
| Immigrants | Zaire | 4.4 /100 | #220 | Tragic 97.8% |
Demographics Similar to Marshallese by Nursery School
In terms of nursery school, the demographic groups most similar to Marshallese are Burmese (98.1%, a difference of 0.0%), Alsatian (98.1%, a difference of 0.0%), Palestinian (98.1%, a difference of 0.010%), Immigrants from Turkey (98.1%, a difference of 0.010%), and Immigrants from Israel (98.1%, a difference of 0.010%).
| Demographics | Rating | Rank | Nursery School |
| Immigrants | Kuwait | 88.9 /100 | #136 | Excellent 98.1% |
| Israelis | 88.2 /100 | #137 | Excellent 98.1% |
| Immigrants | Romania | 88.0 /100 | #138 | Excellent 98.1% |
| Blackfeet | 87.5 /100 | #139 | Excellent 98.1% |
| Palestinians | 83.7 /100 | #140 | Excellent 98.1% |
| Immigrants | Turkey | 83.0 /100 | #141 | Excellent 98.1% |
| Burmese | 81.7 /100 | #142 | Excellent 98.1% |
| Marshallese | 81.2 /100 | #143 | Excellent 98.1% |
| Alsatians | 80.3 /100 | #144 | Excellent 98.1% |
| Immigrants | Israel | 78.5 /100 | #145 | Good 98.1% |
| Filipinos | 78.5 /100 | #146 | Good 98.1% |
| Hmong | 75.7 /100 | #147 | Good 98.1% |
| Immigrants | Greece | 75.4 /100 | #148 | Good 98.1% |
| Apache | 73.2 /100 | #149 | Good 98.1% |
| Jordanians | 72.9 /100 | #150 | Good 98.1% |