Syrian vs Immigrants from Switzerland Doctorate Degree
COMPARE
Syrian
Immigrants from Switzerland
Doctorate Degree
Doctorate Degree Comparison
Syrians
Immigrants from Switzerland
2.1%
DOCTORATE DEGREE
97.1/ 100
METRIC RATING
112th/ 347
METRIC RANK
3.1%
DOCTORATE DEGREE
100.0/ 100
METRIC RATING
6th/ 347
METRIC RANK
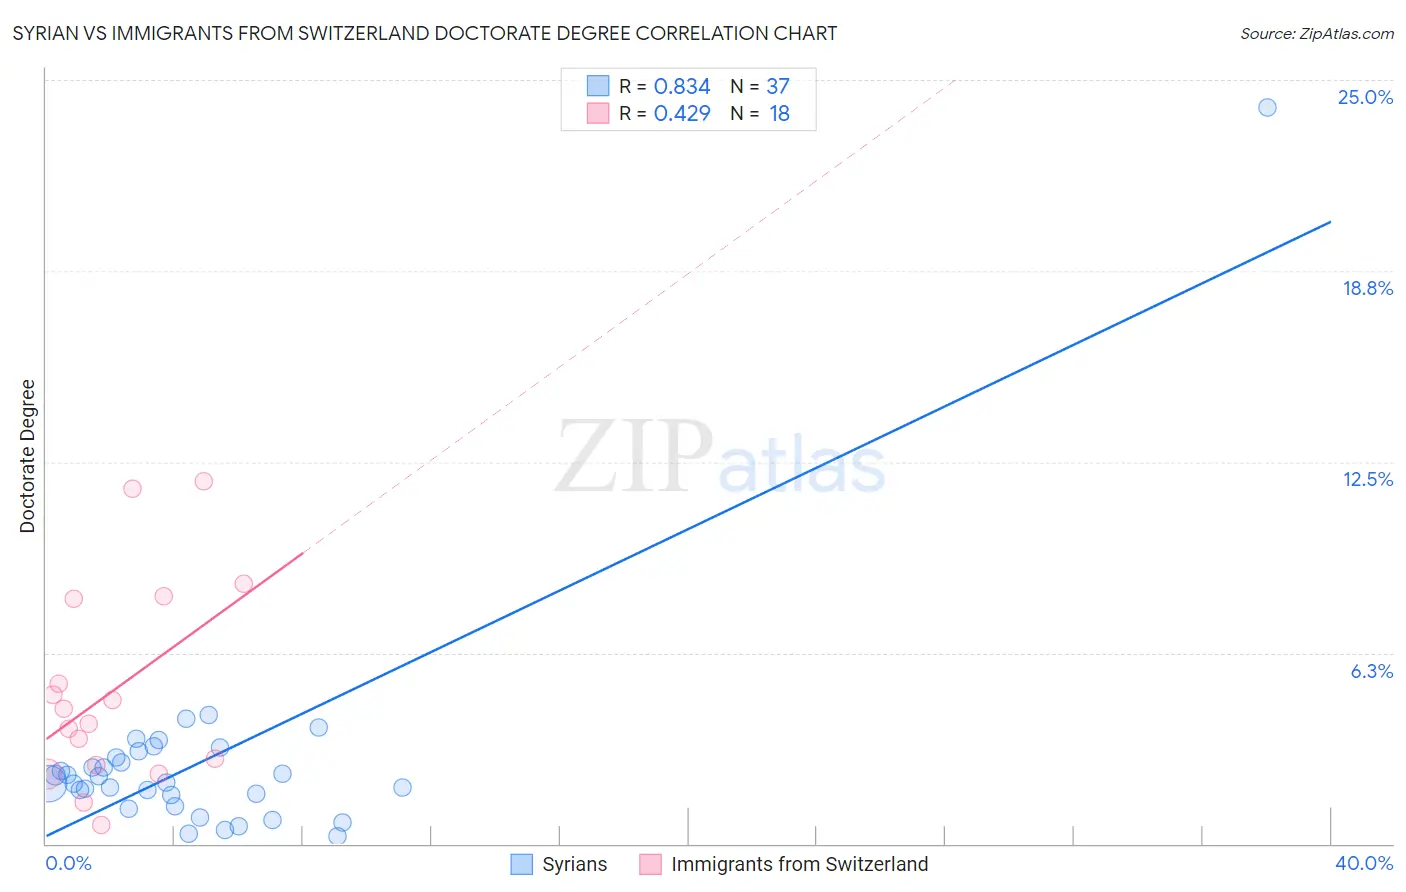
Syrian vs Immigrants from Switzerland Doctorate Degree Correlation Chart
The statistical analysis conducted on geographies consisting of 265,258,861 people shows a very strong positive correlation between the proportion of Syrians and percentage of population with at least doctorate degree education in the United States with a correlation coefficient (R) of 0.834 and weighted average of 2.1%. Similarly, the statistical analysis conducted on geographies consisting of 147,873,421 people shows a moderate positive correlation between the proportion of Immigrants from Switzerland and percentage of population with at least doctorate degree education in the United States with a correlation coefficient (R) of 0.429 and weighted average of 3.1%, a difference of 48.8%.
Doctorate Degree Correlation Summary
| Measurement | Syrian | Immigrants from Switzerland |
| Minimum | 0.24% | 0.62% |
| Maximum | 24.1% | 11.8% |
| Range | 23.9% | 11.2% |
| Mean | 2.7% | 5.0% |
| Median | 2.0% | 4.2% |
| Interquartile 25% (IQ1) | 1.4% | 2.6% |
| Interquartile 75% (IQ3) | 2.9% | 8.0% |
| Interquartile Range (IQR) | 1.5% | 5.5% |
| Standard Deviation (Sample) | 3.8% | 3.3% |
| Standard Deviation (Population) | 3.7% | 3.2% |
Similar Demographics by Doctorate Degree
Demographics Similar to Syrians by Doctorate Degree
In terms of doctorate degree, the demographic groups most similar to Syrians are Immigrants from Pakistan (2.1%, a difference of 0.020%), Brazilian (2.1%, a difference of 0.080%), Ukrainian (2.1%, a difference of 0.15%), Immigrants from Germany (2.1%, a difference of 0.21%), and Immigrants from Italy (2.1%, a difference of 0.21%).
| Demographics | Rating | Rank | Doctorate Degree |
| Arabs | 97.8 /100 | #105 | Exceptional 2.1% |
| Sudanese | 97.7 /100 | #106 | Exceptional 2.1% |
| Europeans | 97.5 /100 | #107 | Exceptional 2.1% |
| Immigrants | Germany | 97.3 /100 | #108 | Exceptional 2.1% |
| Ukrainians | 97.2 /100 | #109 | Exceptional 2.1% |
| Brazilians | 97.2 /100 | #110 | Exceptional 2.1% |
| Immigrants | Pakistan | 97.1 /100 | #111 | Exceptional 2.1% |
| Syrians | 97.1 /100 | #112 | Exceptional 2.1% |
| Immigrants | Italy | 96.9 /100 | #113 | Exceptional 2.1% |
| Immigrants | Croatia | 96.8 /100 | #114 | Exceptional 2.1% |
| Taiwanese | 96.7 /100 | #115 | Exceptional 2.1% |
| Maltese | 96.2 /100 | #116 | Exceptional 2.1% |
| Lebanese | 96.0 /100 | #117 | Exceptional 2.1% |
| Icelanders | 96.0 /100 | #118 | Exceptional 2.1% |
| Pakistanis | 95.8 /100 | #119 | Exceptional 2.0% |
Demographics Similar to Immigrants from Switzerland by Doctorate Degree
In terms of doctorate degree, the demographic groups most similar to Immigrants from Switzerland are Immigrants from China (3.1%, a difference of 0.070%), Immigrants from Israel (3.0%, a difference of 1.4%), Iranian (3.1%, a difference of 1.9%), Immigrants from Iran (3.0%, a difference of 2.1%), and Immigrants from Taiwan (3.2%, a difference of 3.5%).
| Demographics | Rating | Rank | Doctorate Degree |
| Immigrants | Singapore | 100.0 /100 | #1 | Exceptional 3.7% |
| Filipinos | 100.0 /100 | #2 | Exceptional 3.4% |
| Okinawans | 100.0 /100 | #3 | Exceptional 3.3% |
| Immigrants | Taiwan | 100.0 /100 | #4 | Exceptional 3.2% |
| Iranians | 100.0 /100 | #5 | Exceptional 3.1% |
| Immigrants | Switzerland | 100.0 /100 | #6 | Exceptional 3.1% |
| Immigrants | China | 100.0 /100 | #7 | Exceptional 3.1% |
| Immigrants | Israel | 100.0 /100 | #8 | Exceptional 3.0% |
| Immigrants | Iran | 100.0 /100 | #9 | Exceptional 3.0% |
| Immigrants | Eastern Asia | 100.0 /100 | #10 | Exceptional 3.0% |
| Indians (Asian) | 100.0 /100 | #11 | Exceptional 2.9% |
| Immigrants | Belgium | 100.0 /100 | #12 | Exceptional 2.9% |
| Immigrants | Sweden | 100.0 /100 | #13 | Exceptional 2.9% |
| Immigrants | France | 100.0 /100 | #14 | Exceptional 2.9% |
| Immigrants | India | 100.0 /100 | #15 | Exceptional 2.8% |