Moroccan vs Immigrants from Switzerland 4th Grade
COMPARE
Moroccan
Immigrants from Switzerland
4th Grade
4th Grade Comparison
Moroccans
Immigrants from Switzerland
97.3%
4TH GRADE
11.3/ 100
METRIC RATING
207th/ 347
METRIC RANK
97.8%
4TH GRADE
96.1/ 100
METRIC RATING
111th/ 347
METRIC RANK
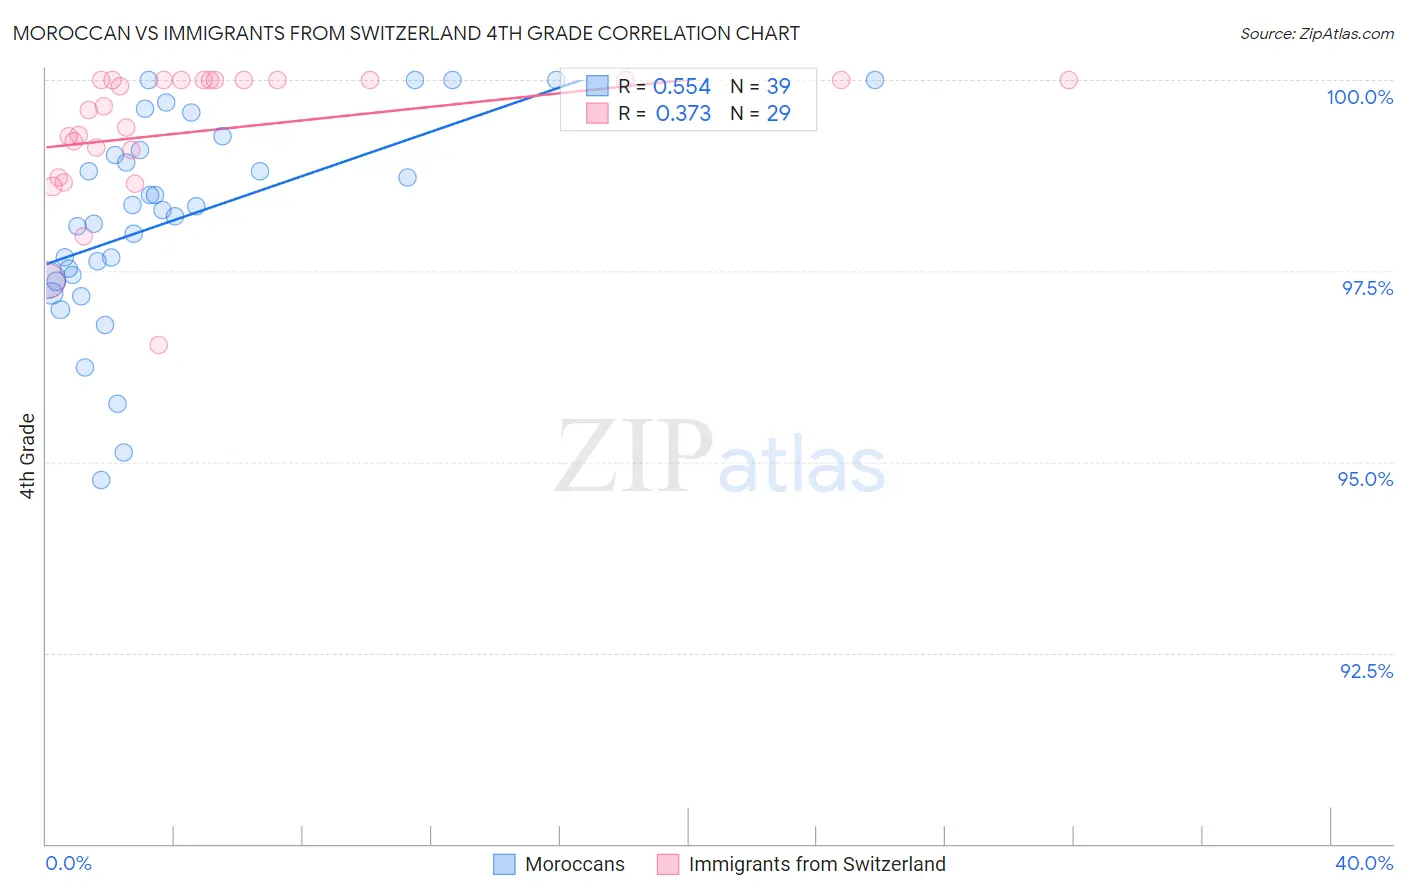
Moroccan vs Immigrants from Switzerland 4th Grade Correlation Chart
The statistical analysis conducted on geographies consisting of 201,817,667 people shows a substantial positive correlation between the proportion of Moroccans and percentage of population with at least 4th grade education in the United States with a correlation coefficient (R) of 0.554 and weighted average of 97.3%. Similarly, the statistical analysis conducted on geographies consisting of 148,082,451 people shows a mild positive correlation between the proportion of Immigrants from Switzerland and percentage of population with at least 4th grade education in the United States with a correlation coefficient (R) of 0.373 and weighted average of 97.8%, a difference of 0.50%.
4th Grade Correlation Summary
| Measurement | Moroccan | Immigrants from Switzerland |
| Minimum | 94.8% | 96.5% |
| Maximum | 100.0% | 100.0% |
| Range | 5.2% | 3.5% |
| Mean | 98.2% | 99.3% |
| Median | 98.3% | 99.7% |
| Interquartile 25% (IQ1) | 97.4% | 98.9% |
| Interquartile 75% (IQ3) | 99.1% | 100.0% |
| Interquartile Range (IQR) | 1.7% | 1.1% |
| Standard Deviation (Sample) | 1.3% | 0.88% |
| Standard Deviation (Population) | 1.3% | 0.87% |
Similar Demographics by 4th Grade
Demographics Similar to Moroccans by 4th Grade
In terms of 4th grade, the demographic groups most similar to Moroccans are Immigrants from Zaire (97.3%, a difference of 0.010%), Immigrants from Bahamas (97.3%, a difference of 0.010%), Paiute (97.3%, a difference of 0.020%), Laotian (97.3%, a difference of 0.020%), and Immigrants from Oceania (97.3%, a difference of 0.020%).
| Demographics | Rating | Rank | 4th Grade |
| Immigrants | Uganda | 19.8 /100 | #200 | Poor 97.4% |
| Immigrants | Southern Europe | 16.2 /100 | #201 | Poor 97.4% |
| Immigrants | Chile | 16.1 /100 | #202 | Poor 97.4% |
| Immigrants | Northern Africa | 15.1 /100 | #203 | Poor 97.4% |
| Africans | 14.6 /100 | #204 | Poor 97.4% |
| Paiute | 13.2 /100 | #205 | Poor 97.3% |
| Immigrants | Zaire | 12.8 /100 | #206 | Poor 97.3% |
| Moroccans | 11.3 /100 | #207 | Poor 97.3% |
| Immigrants | Bahamas | 10.8 /100 | #208 | Poor 97.3% |
| Laotians | 9.3 /100 | #209 | Tragic 97.3% |
| Immigrants | Oceania | 9.1 /100 | #210 | Tragic 97.3% |
| Sudanese | 9.0 /100 | #211 | Tragic 97.3% |
| Tohono O'odham | 8.4 /100 | #212 | Tragic 97.3% |
| Costa Ricans | 8.3 /100 | #213 | Tragic 97.3% |
| Immigrants | Nepal | 7.7 /100 | #214 | Tragic 97.3% |
Demographics Similar to Immigrants from Switzerland by 4th Grade
In terms of 4th grade, the demographic groups most similar to Immigrants from Switzerland are Okinawan (97.8%, a difference of 0.0%), Thai (97.8%, a difference of 0.010%), Basque (97.8%, a difference of 0.010%), Immigrants from Latvia (97.8%, a difference of 0.020%), and Iroquois (97.8%, a difference of 0.020%).
| Demographics | Rating | Rank | 4th Grade |
| Immigrants | Nonimmigrants | 97.5 /100 | #104 | Exceptional 97.9% |
| German Russians | 97.5 /100 | #105 | Exceptional 97.9% |
| Immigrants | Czechoslovakia | 97.5 /100 | #106 | Exceptional 97.9% |
| Bhutanese | 97.4 /100 | #107 | Exceptional 97.9% |
| Immigrants | Singapore | 97.3 /100 | #108 | Exceptional 97.9% |
| Immigrants | Latvia | 96.8 /100 | #109 | Exceptional 97.8% |
| Thais | 96.7 /100 | #110 | Exceptional 97.8% |
| Immigrants | Switzerland | 96.1 /100 | #111 | Exceptional 97.8% |
| Okinawans | 96.0 /100 | #112 | Exceptional 97.8% |
| Basques | 95.8 /100 | #113 | Exceptional 97.8% |
| Iroquois | 95.4 /100 | #114 | Exceptional 97.8% |
| Lebanese | 95.4 /100 | #115 | Exceptional 97.8% |
| Immigrants | Croatia | 95.2 /100 | #116 | Exceptional 97.8% |
| Syrians | 94.9 /100 | #117 | Exceptional 97.8% |
| Menominee | 94.9 /100 | #118 | Exceptional 97.8% |