Immigrants from Armenia vs Immigrants from the Azores No Schooling Completed
COMPARE
Immigrants from Armenia
Immigrants from the Azores
No Schooling Completed
No Schooling Completed Comparison
Immigrants from Armenia
Immigrants from the Azores
3.3%
NO SCHOOLING COMPLETED
0.0/ 100
METRIC RATING
330th/ 347
METRIC RANK
3.0%
NO SCHOOLING COMPLETED
0.0/ 100
METRIC RATING
311th/ 347
METRIC RANK
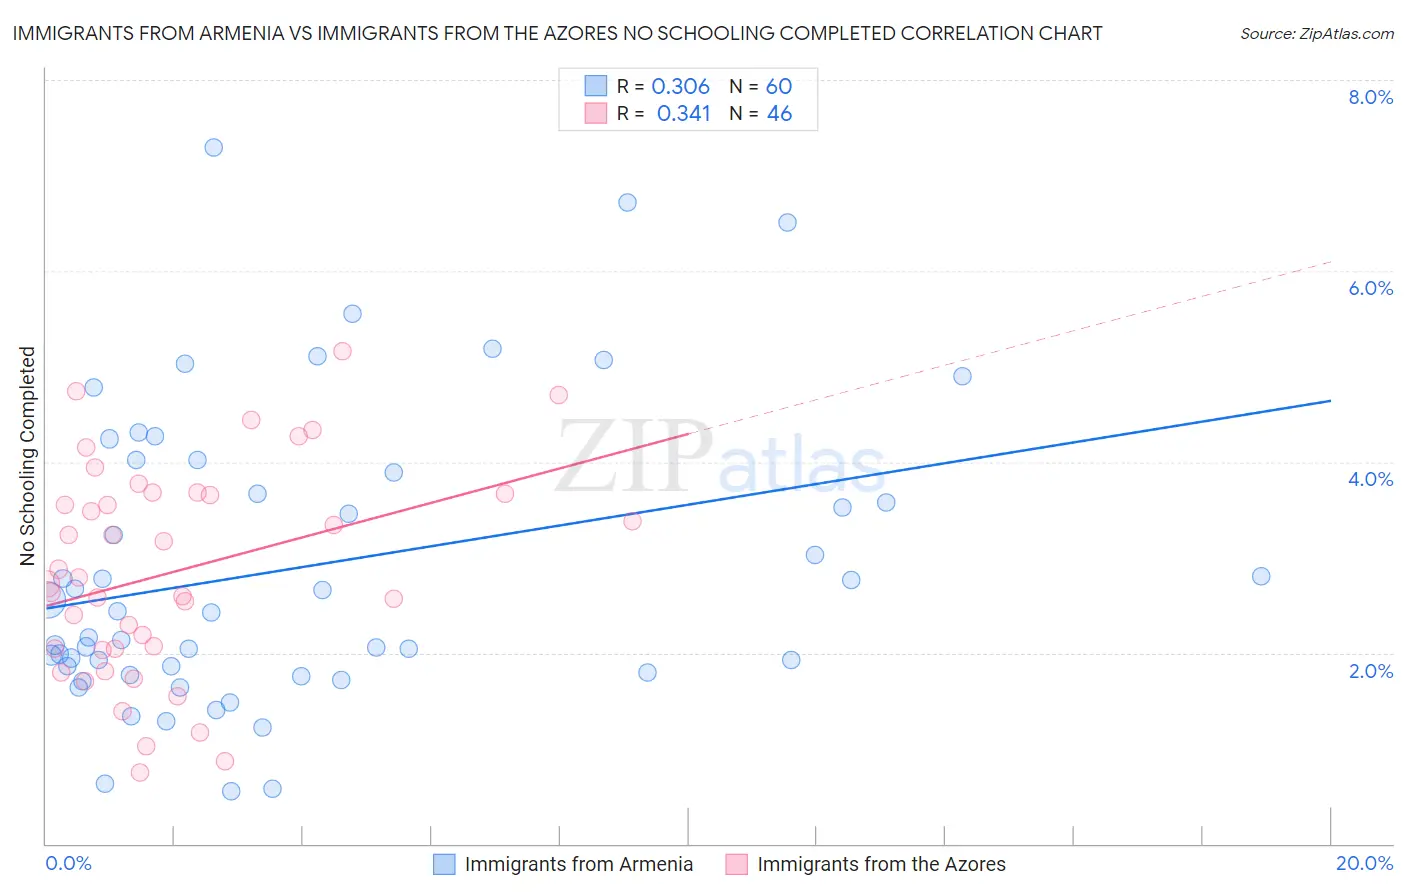
Immigrants from Armenia vs Immigrants from the Azores No Schooling Completed Correlation Chart
The statistical analysis conducted on geographies consisting of 97,592,780 people shows a mild positive correlation between the proportion of Immigrants from Armenia and percentage of population with no schooling in the United States with a correlation coefficient (R) of 0.306 and weighted average of 3.3%. Similarly, the statistical analysis conducted on geographies consisting of 46,184,516 people shows a mild positive correlation between the proportion of Immigrants from the Azores and percentage of population with no schooling in the United States with a correlation coefficient (R) of 0.341 and weighted average of 3.0%, a difference of 10.1%.
No Schooling Completed Correlation Summary
| Measurement | Immigrants from Armenia | Immigrants from the Azores |
| Minimum | 0.55% | 0.75% |
| Maximum | 7.3% | 5.2% |
| Range | 6.7% | 4.4% |
| Mean | 2.9% | 2.9% |
| Median | 2.4% | 2.8% |
| Interquartile 25% (IQ1) | 1.8% | 2.0% |
| Interquartile 75% (IQ3) | 4.0% | 3.7% |
| Interquartile Range (IQR) | 2.1% | 1.6% |
| Standard Deviation (Sample) | 1.6% | 1.1% |
| Standard Deviation (Population) | 1.5% | 1.1% |
Demographics Similar to Immigrants from Armenia and Immigrants from the Azores by No Schooling Completed
In terms of no schooling completed, the demographic groups most similar to Immigrants from Armenia are Immigrants from Vietnam (3.3%, a difference of 0.42%), Mexican (3.3%, a difference of 1.5%), Immigrants from Latin America (3.3%, a difference of 1.7%), Indonesian (3.2%, a difference of 4.3%), and Dominican (3.2%, a difference of 4.3%). Similarly, the demographic groups most similar to Immigrants from the Azores are Guyanese (3.0%, a difference of 0.10%), Sri Lankan (3.0%, a difference of 0.28%), Honduran (3.1%, a difference of 0.79%), Immigrants from Belize (3.1%, a difference of 0.88%), and Immigrants from Nicaragua (3.1%, a difference of 1.1%).
| Demographics | Rating | Rank | No Schooling Completed |
| Guyanese | 0.0 /100 | #310 | Tragic 3.0% |
| Immigrants | Azores | 0.0 /100 | #311 | Tragic 3.0% |
| Sri Lankans | 0.0 /100 | #312 | Tragic 3.0% |
| Hondurans | 0.0 /100 | #313 | Tragic 3.1% |
| Immigrants | Belize | 0.0 /100 | #314 | Tragic 3.1% |
| Immigrants | Nicaragua | 0.0 /100 | #315 | Tragic 3.1% |
| Immigrants | Ecuador | 0.0 /100 | #316 | Tragic 3.1% |
| Cape Verdeans | 0.0 /100 | #317 | Tragic 3.1% |
| Immigrants | Guyana | 0.0 /100 | #318 | Tragic 3.1% |
| Immigrants | Burma/Myanmar | 0.0 /100 | #319 | Tragic 3.1% |
| Immigrants | Bangladesh | 0.0 /100 | #320 | Tragic 3.1% |
| Immigrants | Laos | 0.0 /100 | #321 | Tragic 3.1% |
| Immigrants | Honduras | 0.0 /100 | #322 | Tragic 3.2% |
| Vietnamese | 0.0 /100 | #323 | Tragic 3.2% |
| Mexican American Indians | 0.0 /100 | #324 | Tragic 3.2% |
| Dominicans | 0.0 /100 | #325 | Tragic 3.2% |
| Indonesians | 0.0 /100 | #326 | Tragic 3.2% |
| Immigrants | Latin America | 0.0 /100 | #327 | Tragic 3.3% |
| Mexicans | 0.0 /100 | #328 | Tragic 3.3% |
| Immigrants | Vietnam | 0.0 /100 | #329 | Tragic 3.3% |
| Immigrants | Armenia | 0.0 /100 | #330 | Tragic 3.3% |