Immigrants from Ireland vs Immigrants from the Azores No Schooling Completed
COMPARE
Immigrants from Ireland
Immigrants from the Azores
No Schooling Completed
No Schooling Completed Comparison
Immigrants from Ireland
Immigrants from the Azores
1.8%
NO SCHOOLING COMPLETED
98.4/ 100
METRIC RATING
97th/ 347
METRIC RANK
3.0%
NO SCHOOLING COMPLETED
0.0/ 100
METRIC RATING
311th/ 347
METRIC RANK
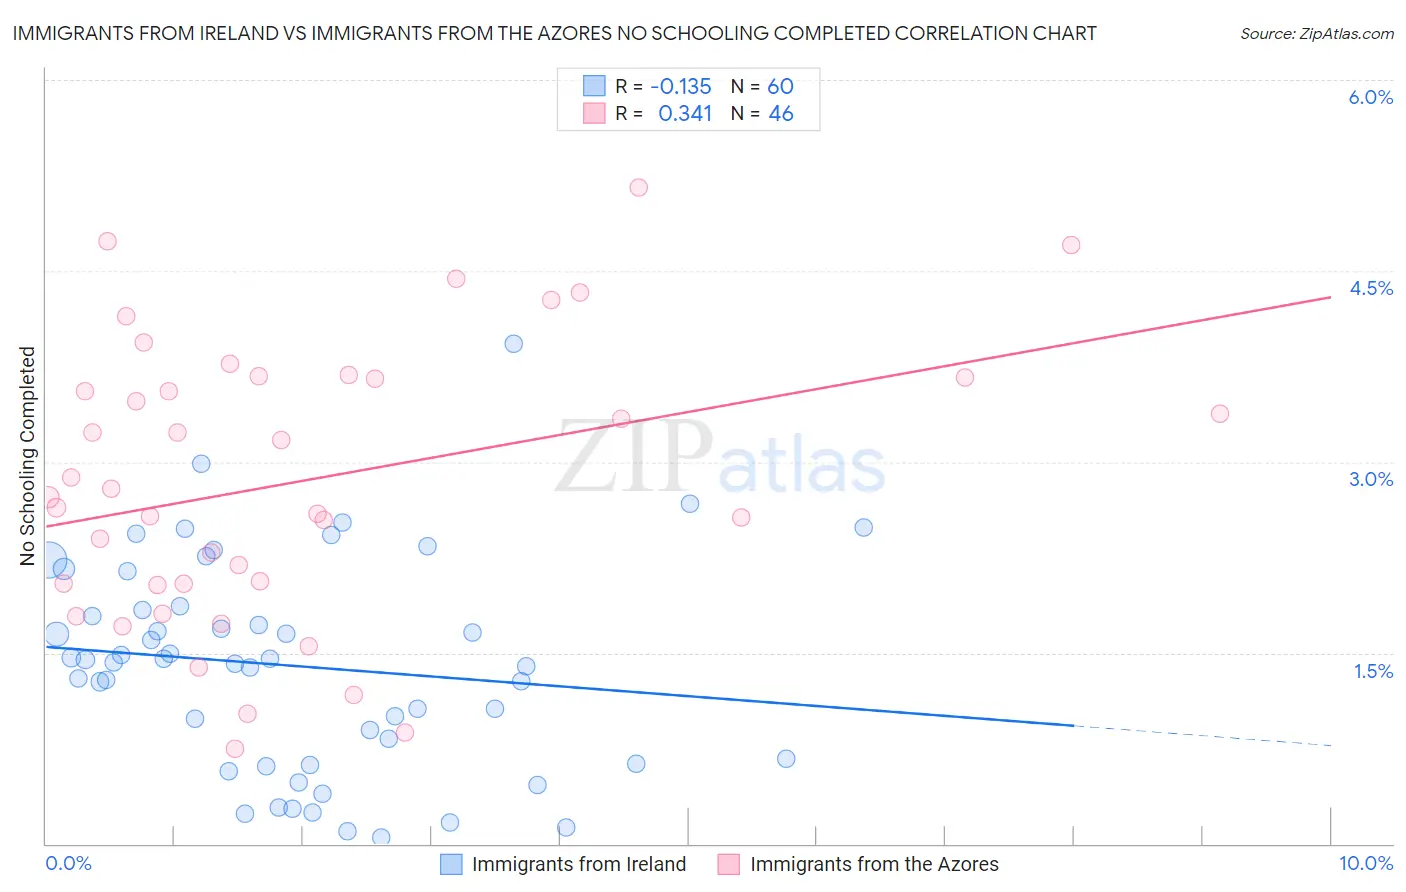
Immigrants from Ireland vs Immigrants from the Azores No Schooling Completed Correlation Chart
The statistical analysis conducted on geographies consisting of 238,979,486 people shows a poor negative correlation between the proportion of Immigrants from Ireland and percentage of population with no schooling in the United States with a correlation coefficient (R) of -0.135 and weighted average of 1.8%. Similarly, the statistical analysis conducted on geographies consisting of 46,184,516 people shows a mild positive correlation between the proportion of Immigrants from the Azores and percentage of population with no schooling in the United States with a correlation coefficient (R) of 0.341 and weighted average of 3.0%, a difference of 68.5%.
No Schooling Completed Correlation Summary
| Measurement | Immigrants from Ireland | Immigrants from the Azores |
| Minimum | 0.045% | 0.75% |
| Maximum | 3.9% | 5.2% |
| Range | 3.9% | 4.4% |
| Mean | 1.4% | 2.9% |
| Median | 1.4% | 2.8% |
| Interquartile 25% (IQ1) | 0.65% | 2.0% |
| Interquartile 75% (IQ3) | 1.8% | 3.7% |
| Interquartile Range (IQR) | 1.2% | 1.6% |
| Standard Deviation (Sample) | 0.83% | 1.1% |
| Standard Deviation (Population) | 0.82% | 1.1% |
Similar Demographics by No Schooling Completed
Demographics Similar to Immigrants from Ireland by No Schooling Completed
In terms of no schooling completed, the demographic groups most similar to Immigrants from Ireland are Bhutanese (1.8%, a difference of 0.18%), Iranian (1.8%, a difference of 0.28%), Puget Sound Salish (1.8%, a difference of 0.41%), Nonimmigrants (1.8%, a difference of 0.42%), and Choctaw (1.8%, a difference of 0.47%).
| Demographics | Rating | Rank | No Schooling Completed |
| Sioux | 99.0 /100 | #90 | Exceptional 1.8% |
| Immigrants | Germany | 99.0 /100 | #91 | Exceptional 1.8% |
| Romanians | 98.8 /100 | #92 | Exceptional 1.8% |
| Turks | 98.7 /100 | #93 | Exceptional 1.8% |
| Immigrants | Nonimmigrants | 98.5 /100 | #94 | Exceptional 1.8% |
| Puget Sound Salish | 98.5 /100 | #95 | Exceptional 1.8% |
| Bhutanese | 98.4 /100 | #96 | Exceptional 1.8% |
| Immigrants | Ireland | 98.4 /100 | #97 | Exceptional 1.8% |
| Iranians | 98.2 /100 | #98 | Exceptional 1.8% |
| Choctaw | 98.1 /100 | #99 | Exceptional 1.8% |
| Immigrants | Singapore | 98.0 /100 | #100 | Exceptional 1.8% |
| Immigrants | Czechoslovakia | 97.9 /100 | #101 | Exceptional 1.8% |
| Immigrants | Switzerland | 97.9 /100 | #102 | Exceptional 1.8% |
| Basques | 97.9 /100 | #103 | Exceptional 1.8% |
| Thais | 97.5 /100 | #104 | Exceptional 1.8% |
Demographics Similar to Immigrants from the Azores by No Schooling Completed
In terms of no schooling completed, the demographic groups most similar to Immigrants from the Azores are Guyanese (3.0%, a difference of 0.10%), Hispanic or Latino (3.0%, a difference of 0.15%), Sri Lankan (3.0%, a difference of 0.28%), Honduran (3.1%, a difference of 0.79%), and Immigrants from Belize (3.1%, a difference of 0.88%).
| Demographics | Rating | Rank | No Schooling Completed |
| Nicaraguans | 0.0 /100 | #304 | Tragic 2.9% |
| Ecuadorians | 0.0 /100 | #305 | Tragic 3.0% |
| Belizeans | 0.0 /100 | #306 | Tragic 3.0% |
| Immigrants | Haiti | 0.0 /100 | #307 | Tragic 3.0% |
| Immigrants | Somalia | 0.0 /100 | #308 | Tragic 3.0% |
| Hispanics or Latinos | 0.0 /100 | #309 | Tragic 3.0% |
| Guyanese | 0.0 /100 | #310 | Tragic 3.0% |
| Immigrants | Azores | 0.0 /100 | #311 | Tragic 3.0% |
| Sri Lankans | 0.0 /100 | #312 | Tragic 3.0% |
| Hondurans | 0.0 /100 | #313 | Tragic 3.1% |
| Immigrants | Belize | 0.0 /100 | #314 | Tragic 3.1% |
| Immigrants | Nicaragua | 0.0 /100 | #315 | Tragic 3.1% |
| Immigrants | Ecuador | 0.0 /100 | #316 | Tragic 3.1% |
| Cape Verdeans | 0.0 /100 | #317 | Tragic 3.1% |
| Immigrants | Guyana | 0.0 /100 | #318 | Tragic 3.1% |