Sri Lankan vs Cherokee Doctorate Degree
COMPARE
Sri Lankan
Cherokee
Doctorate Degree
Doctorate Degree Comparison
Sri Lankans
Cherokee
1.9%
DOCTORATE DEGREE
60.3/ 100
METRIC RATING
168th/ 347
METRIC RANK
1.5%
DOCTORATE DEGREE
0.3/ 100
METRIC RATING
286th/ 347
METRIC RANK
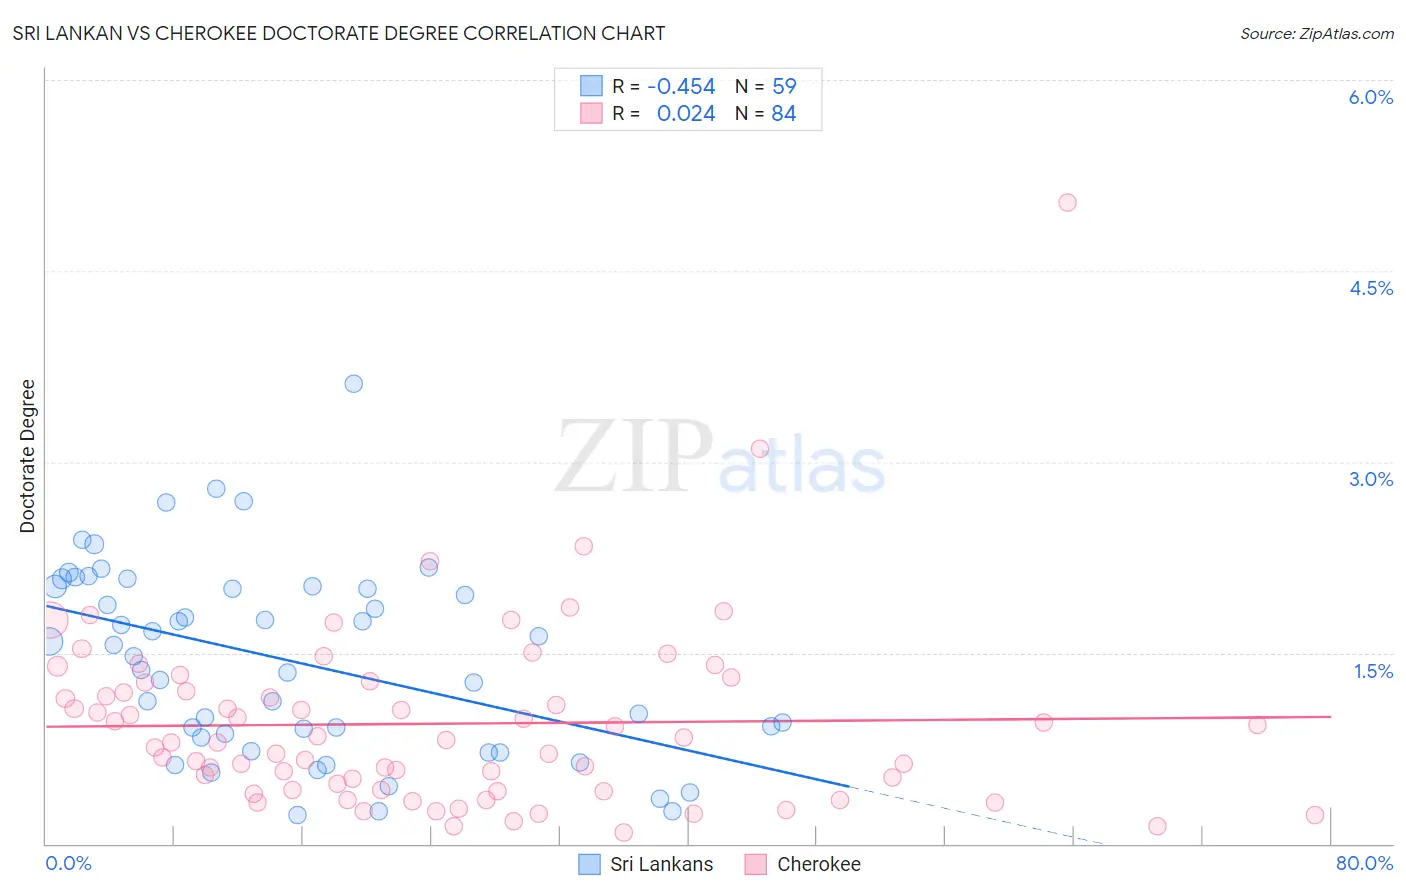
Sri Lankan vs Cherokee Doctorate Degree Correlation Chart
The statistical analysis conducted on geographies consisting of 435,479,359 people shows a moderate negative correlation between the proportion of Sri Lankans and percentage of population with at least doctorate degree education in the United States with a correlation coefficient (R) of -0.454 and weighted average of 1.9%. Similarly, the statistical analysis conducted on geographies consisting of 478,818,263 people shows no correlation between the proportion of Cherokee and percentage of population with at least doctorate degree education in the United States with a correlation coefficient (R) of 0.024 and weighted average of 1.5%, a difference of 28.5%.
Doctorate Degree Correlation Summary
| Measurement | Sri Lankan | Cherokee |
| Minimum | 0.22% | 0.091% |
| Maximum | 3.6% | 5.0% |
| Range | 3.4% | 5.0% |
| Mean | 1.4% | 0.94% |
| Median | 1.5% | 0.81% |
| Interquartile 25% (IQ1) | 0.83% | 0.43% |
| Interquartile 75% (IQ3) | 2.0% | 1.2% |
| Interquartile Range (IQR) | 1.2% | 0.81% |
| Standard Deviation (Sample) | 0.75% | 0.73% |
| Standard Deviation (Population) | 0.74% | 0.72% |
Similar Demographics by Doctorate Degree
Demographics Similar to Sri Lankans by Doctorate Degree
In terms of doctorate degree, the demographic groups most similar to Sri Lankans are Macedonian (1.9%, a difference of 0.10%), Spaniard (1.9%, a difference of 0.49%), Scotch-Irish (1.9%, a difference of 0.51%), Vietnamese (1.9%, a difference of 0.82%), and Celtic (1.9%, a difference of 1.0%).
| Demographics | Rating | Rank | Doctorate Degree |
| Immigrants | Middle Africa | 68.8 /100 | #161 | Good 1.9% |
| Irish | 67.5 /100 | #162 | Good 1.9% |
| Czechs | 67.3 /100 | #163 | Good 1.9% |
| Celtics | 66.7 /100 | #164 | Good 1.9% |
| Scotch-Irish | 63.6 /100 | #165 | Good 1.9% |
| Spaniards | 63.5 /100 | #166 | Good 1.9% |
| Macedonians | 60.9 /100 | #167 | Good 1.9% |
| Sri Lankans | 60.3 /100 | #168 | Good 1.9% |
| Vietnamese | 54.8 /100 | #169 | Average 1.9% |
| Costa Ricans | 53.3 /100 | #170 | Average 1.8% |
| Bermudans | 52.1 /100 | #171 | Average 1.8% |
| Belgians | 50.3 /100 | #172 | Average 1.8% |
| Norwegians | 50.0 /100 | #173 | Average 1.8% |
| Immigrants | Bangladesh | 50.0 /100 | #174 | Average 1.8% |
| Immigrants | Thailand | 49.4 /100 | #175 | Average 1.8% |
Demographics Similar to Cherokee by Doctorate Degree
In terms of doctorate degree, the demographic groups most similar to Cherokee are Cajun (1.5%, a difference of 0.17%), Malaysian (1.5%, a difference of 0.18%), Jamaican (1.5%, a difference of 0.21%), Central American (1.5%, a difference of 0.24%), and British West Indian (1.5%, a difference of 0.29%).
| Demographics | Rating | Rank | Doctorate Degree |
| Marshallese | 0.4 /100 | #279 | Tragic 1.5% |
| Ecuadorians | 0.4 /100 | #280 | Tragic 1.5% |
| Tohono O'odham | 0.4 /100 | #281 | Tragic 1.5% |
| British West Indians | 0.3 /100 | #282 | Tragic 1.5% |
| Central Americans | 0.3 /100 | #283 | Tragic 1.5% |
| Jamaicans | 0.3 /100 | #284 | Tragic 1.5% |
| Malaysians | 0.3 /100 | #285 | Tragic 1.5% |
| Cherokee | 0.3 /100 | #286 | Tragic 1.5% |
| Cajuns | 0.3 /100 | #287 | Tragic 1.5% |
| Immigrants | El Salvador | 0.3 /100 | #288 | Tragic 1.4% |
| Cape Verdeans | 0.3 /100 | #289 | Tragic 1.4% |
| Choctaw | 0.3 /100 | #290 | Tragic 1.4% |
| Blacks/African Americans | 0.3 /100 | #291 | Tragic 1.4% |
| Alaska Natives | 0.3 /100 | #292 | Tragic 1.4% |
| Immigrants | Yemen | 0.2 /100 | #293 | Tragic 1.4% |