Mongolian vs Serbian 10th Grade
COMPARE
Mongolian
Serbian
10th Grade
10th Grade Comparison
Mongolians
Serbians
94.0%
10TH GRADE
74.4/ 100
METRIC RATING
156th/ 347
METRIC RANK
95.1%
10TH GRADE
99.9/ 100
METRIC RATING
47th/ 347
METRIC RANK
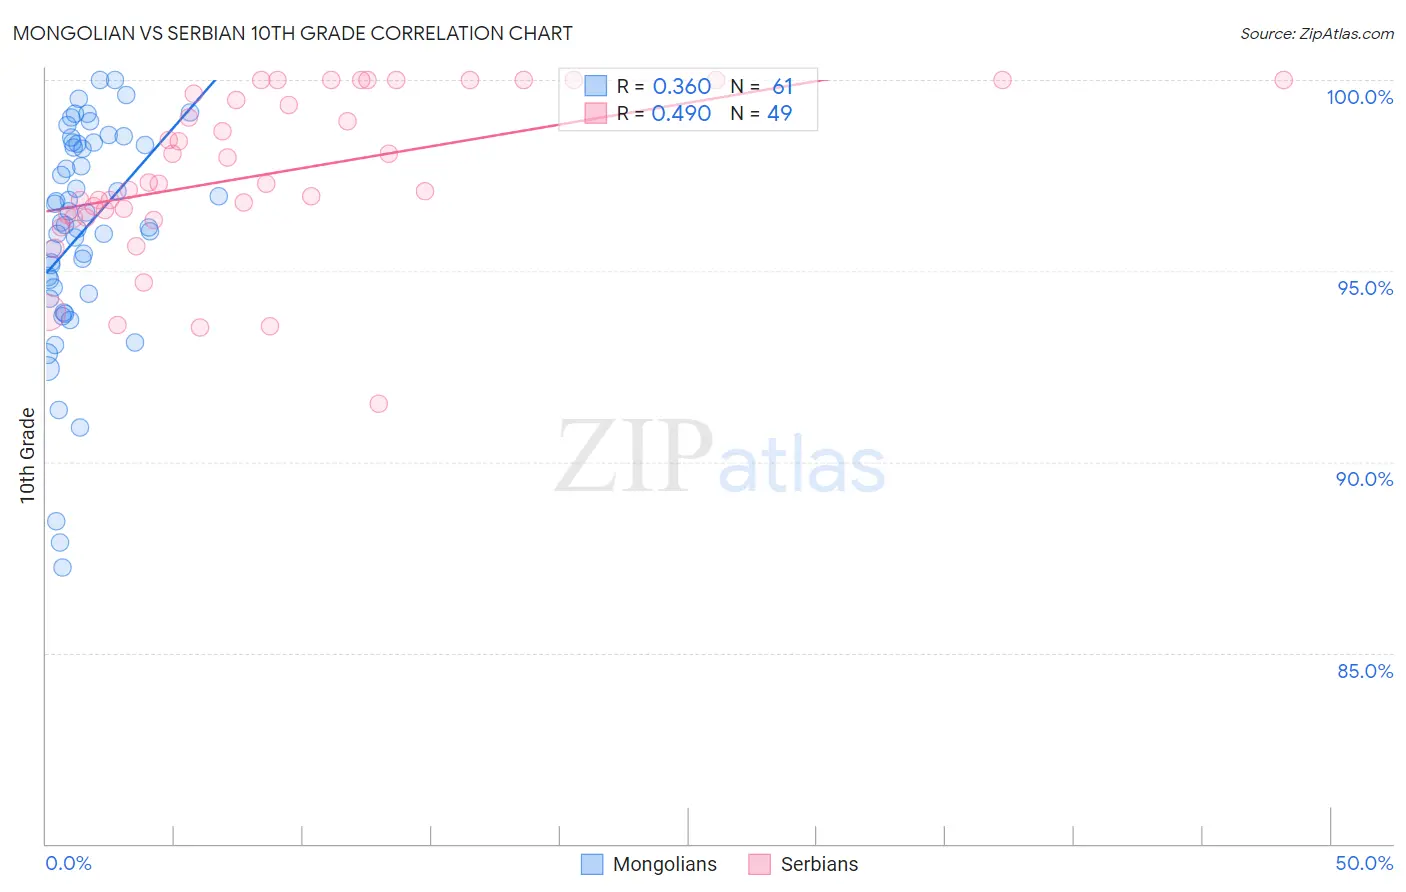
Mongolian vs Serbian 10th Grade Correlation Chart
The statistical analysis conducted on geographies consisting of 140,362,004 people shows a mild positive correlation between the proportion of Mongolians and percentage of population with at least 10th grade education in the United States with a correlation coefficient (R) of 0.360 and weighted average of 94.0%. Similarly, the statistical analysis conducted on geographies consisting of 267,640,774 people shows a moderate positive correlation between the proportion of Serbians and percentage of population with at least 10th grade education in the United States with a correlation coefficient (R) of 0.490 and weighted average of 95.1%, a difference of 1.3%.
10th Grade Correlation Summary
| Measurement | Mongolian | Serbian |
| Minimum | 87.2% | 91.5% |
| Maximum | 100.0% | 100.0% |
| Range | 12.8% | 8.5% |
| Mean | 96.0% | 97.6% |
| Median | 96.3% | 97.3% |
| Interquartile 25% (IQ1) | 94.5% | 96.4% |
| Interquartile 75% (IQ3) | 98.3% | 99.8% |
| Interquartile Range (IQR) | 3.9% | 3.4% |
| Standard Deviation (Sample) | 2.9% | 2.1% |
| Standard Deviation (Population) | 2.9% | 2.1% |
Similar Demographics by 10th Grade
Demographics Similar to Mongolians by 10th Grade
In terms of 10th grade, the demographic groups most similar to Mongolians are Immigrants from Brazil (94.0%, a difference of 0.010%), Immigrants from Kenya (94.0%, a difference of 0.010%), Spanish (94.0%, a difference of 0.010%), Kiowa (93.9%, a difference of 0.010%), and Immigrants from Italy (94.0%, a difference of 0.040%).
| Demographics | Rating | Rank | 10th Grade |
| Ugandans | 80.7 /100 | #149 | Excellent 94.0% |
| Egyptians | 79.6 /100 | #150 | Good 94.0% |
| Kenyans | 79.1 /100 | #151 | Good 94.0% |
| Immigrants | Italy | 78.0 /100 | #152 | Good 94.0% |
| Immigrants | Brazil | 75.5 /100 | #153 | Good 94.0% |
| Immigrants | Kenya | 75.3 /100 | #154 | Good 94.0% |
| Spanish | 74.9 /100 | #155 | Good 94.0% |
| Mongolians | 74.4 /100 | #156 | Good 94.0% |
| Kiowa | 73.3 /100 | #157 | Good 93.9% |
| Bermudans | 71.0 /100 | #158 | Good 93.9% |
| Chileans | 70.2 /100 | #159 | Good 93.9% |
| Pakistanis | 70.1 /100 | #160 | Good 93.9% |
| Assyrians/Chaldeans/Syriacs | 69.7 /100 | #161 | Good 93.9% |
| Immigrants | Poland | 69.6 /100 | #162 | Good 93.9% |
| Venezuelans | 69.5 /100 | #163 | Good 93.9% |
Demographics Similar to Serbians by 10th Grade
In terms of 10th grade, the demographic groups most similar to Serbians are Czechoslovakian (95.1%, a difference of 0.010%), Immigrants from Northern Europe (95.2%, a difference of 0.020%), Greek (95.2%, a difference of 0.020%), Australian (95.1%, a difference of 0.020%), and Macedonian (95.2%, a difference of 0.030%).
| Demographics | Rating | Rank | 10th Grade |
| Scotch-Irish | 99.9 /100 | #40 | Exceptional 95.2% |
| Russians | 99.9 /100 | #41 | Exceptional 95.2% |
| Slavs | 99.9 /100 | #42 | Exceptional 95.2% |
| Macedonians | 99.9 /100 | #43 | Exceptional 95.2% |
| Immigrants | Northern Europe | 99.9 /100 | #44 | Exceptional 95.2% |
| Greeks | 99.9 /100 | #45 | Exceptional 95.2% |
| Czechoslovakians | 99.9 /100 | #46 | Exceptional 95.1% |
| Serbians | 99.9 /100 | #47 | Exceptional 95.1% |
| Australians | 99.9 /100 | #48 | Exceptional 95.1% |
| Immigrants | Austria | 99.9 /100 | #49 | Exceptional 95.1% |
| Immigrants | Canada | 99.8 /100 | #50 | Exceptional 95.1% |
| Austrians | 99.8 /100 | #51 | Exceptional 95.1% |
| Ottawa | 99.8 /100 | #52 | Exceptional 95.1% |
| Immigrants | North America | 99.8 /100 | #53 | Exceptional 95.0% |
| Immigrants | Lithuania | 99.8 /100 | #54 | Exceptional 95.0% |