Jordanian vs Immigrants from Nigeria 10th Grade
COMPARE
Jordanian
Immigrants from Nigeria
10th Grade
10th Grade Comparison
Jordanians
Immigrants from Nigeria
94.4%
10TH GRADE
95.6/ 100
METRIC RATING
118th/ 347
METRIC RANK
92.7%
10TH GRADE
0.7/ 100
METRIC RATING
256th/ 347
METRIC RANK
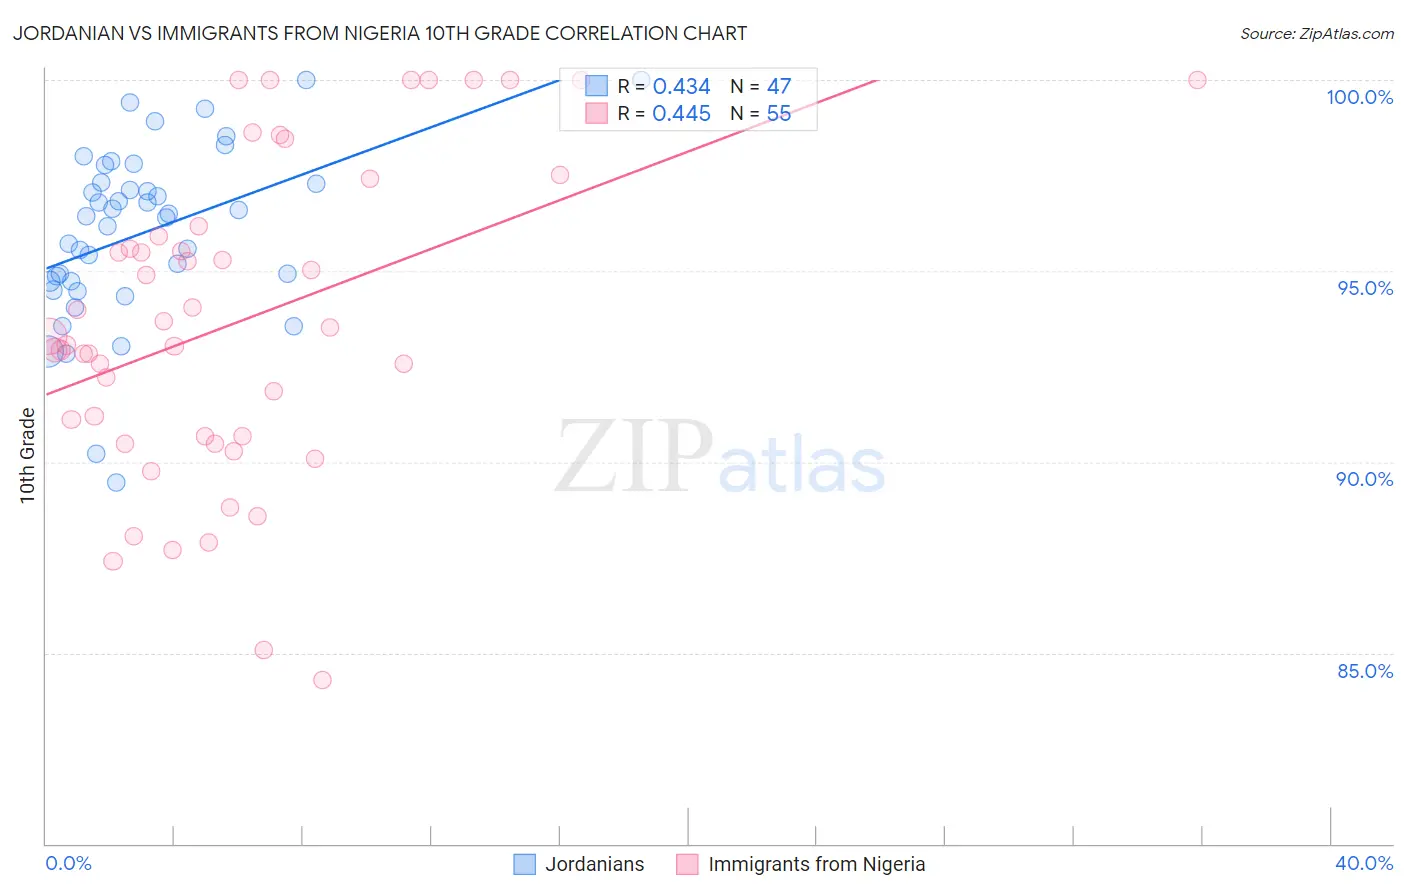
Jordanian vs Immigrants from Nigeria 10th Grade Correlation Chart
The statistical analysis conducted on geographies consisting of 166,402,085 people shows a moderate positive correlation between the proportion of Jordanians and percentage of population with at least 10th grade education in the United States with a correlation coefficient (R) of 0.434 and weighted average of 94.4%. Similarly, the statistical analysis conducted on geographies consisting of 283,441,873 people shows a moderate positive correlation between the proportion of Immigrants from Nigeria and percentage of population with at least 10th grade education in the United States with a correlation coefficient (R) of 0.445 and weighted average of 92.7%, a difference of 1.8%.
10th Grade Correlation Summary
| Measurement | Jordanian | Immigrants from Nigeria |
| Minimum | 89.5% | 84.3% |
| Maximum | 100.0% | 100.0% |
| Range | 10.5% | 15.7% |
| Mean | 96.0% | 93.7% |
| Median | 96.4% | 93.3% |
| Interquartile 25% (IQ1) | 94.7% | 90.7% |
| Interquartile 75% (IQ3) | 97.3% | 96.2% |
| Interquartile Range (IQR) | 2.6% | 5.5% |
| Standard Deviation (Sample) | 2.3% | 4.1% |
| Standard Deviation (Population) | 2.2% | 4.1% |
Similar Demographics by 10th Grade
Demographics Similar to Jordanians by 10th Grade
In terms of 10th grade, the demographic groups most similar to Jordanians are Immigrants from Hungary (94.4%, a difference of 0.010%), Immigrants from Israel (94.4%, a difference of 0.010%), Immigrants from Taiwan (94.4%, a difference of 0.010%), Immigrants from Belarus (94.4%, a difference of 0.020%), and Inupiat (94.4%, a difference of 0.020%).
| Demographics | Rating | Rank | 10th Grade |
| Immigrants | Zimbabwe | 96.8 /100 | #111 | Exceptional 94.4% |
| Immigrants | Kuwait | 96.8 /100 | #112 | Exceptional 94.4% |
| Palestinians | 96.5 /100 | #113 | Exceptional 94.4% |
| German Russians | 96.3 /100 | #114 | Exceptional 94.4% |
| Delaware | 96.3 /100 | #115 | Exceptional 94.4% |
| Sioux | 96.2 /100 | #116 | Exceptional 94.4% |
| Immigrants | Hungary | 95.8 /100 | #117 | Exceptional 94.4% |
| Jordanians | 95.6 /100 | #118 | Exceptional 94.4% |
| Immigrants | Israel | 95.4 /100 | #119 | Exceptional 94.4% |
| Immigrants | Taiwan | 95.3 /100 | #120 | Exceptional 94.4% |
| Immigrants | Belarus | 95.2 /100 | #121 | Exceptional 94.4% |
| Inupiat | 95.1 /100 | #122 | Exceptional 94.4% |
| Cree | 95.1 /100 | #123 | Exceptional 94.4% |
| Basques | 94.9 /100 | #124 | Exceptional 94.3% |
| Americans | 94.4 /100 | #125 | Exceptional 94.3% |
Demographics Similar to Immigrants from Nigeria by 10th Grade
In terms of 10th grade, the demographic groups most similar to Immigrants from Nigeria are Immigrants from Bolivia (92.7%, a difference of 0.010%), U.S. Virgin Islander (92.7%, a difference of 0.010%), Immigrants from Costa Rica (92.7%, a difference of 0.020%), Armenian (92.7%, a difference of 0.060%), and Immigrants from Jamaica (92.6%, a difference of 0.060%).
| Demographics | Rating | Rank | 10th Grade |
| Immigrants | Senegal | 1.4 /100 | #249 | Tragic 92.8% |
| Jamaicans | 1.2 /100 | #250 | Tragic 92.8% |
| Immigrants | Thailand | 1.0 /100 | #251 | Tragic 92.8% |
| South Americans | 0.9 /100 | #252 | Tragic 92.8% |
| Ghanaians | 0.9 /100 | #253 | Tragic 92.8% |
| Armenians | 0.9 /100 | #254 | Tragic 92.7% |
| Immigrants | Bolivia | 0.7 /100 | #255 | Tragic 92.7% |
| Immigrants | Nigeria | 0.7 /100 | #256 | Tragic 92.7% |
| U.S. Virgin Islanders | 0.7 /100 | #257 | Tragic 92.7% |
| Immigrants | Costa Rica | 0.6 /100 | #258 | Tragic 92.7% |
| Immigrants | Jamaica | 0.5 /100 | #259 | Tragic 92.6% |
| Immigrants | Uzbekistan | 0.5 /100 | #260 | Tragic 92.6% |
| Paiute | 0.4 /100 | #261 | Tragic 92.6% |
| Immigrants | South America | 0.4 /100 | #262 | Tragic 92.6% |
| Apache | 0.4 /100 | #263 | Tragic 92.6% |