Mongolian vs Immigrants from Dominican Republic 10th Grade
COMPARE
Mongolian
Immigrants from Dominican Republic
10th Grade
10th Grade Comparison
Mongolians
Immigrants from Dominican Republic
94.0%
10TH GRADE
74.4/ 100
METRIC RATING
156th/ 347
METRIC RANK
88.7%
10TH GRADE
0.0/ 100
METRIC RATING
335th/ 347
METRIC RANK
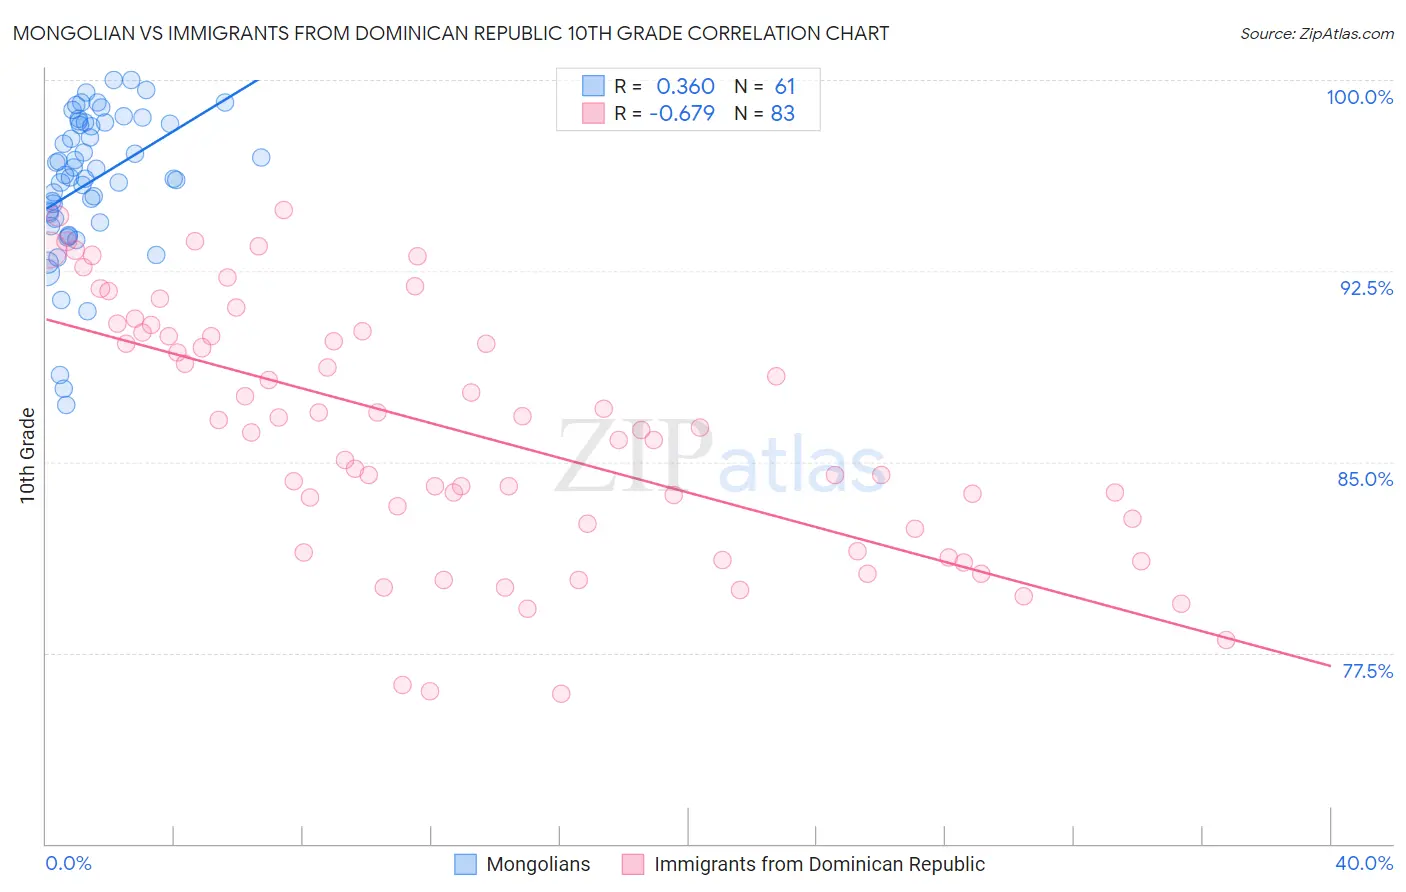
Mongolian vs Immigrants from Dominican Republic 10th Grade Correlation Chart
The statistical analysis conducted on geographies consisting of 140,362,004 people shows a mild positive correlation between the proportion of Mongolians and percentage of population with at least 10th grade education in the United States with a correlation coefficient (R) of 0.360 and weighted average of 94.0%. Similarly, the statistical analysis conducted on geographies consisting of 275,144,349 people shows a significant negative correlation between the proportion of Immigrants from Dominican Republic and percentage of population with at least 10th grade education in the United States with a correlation coefficient (R) of -0.679 and weighted average of 88.7%, a difference of 5.9%.
10th Grade Correlation Summary
| Measurement | Mongolian | Immigrants from Dominican Republic |
| Minimum | 87.2% | 75.9% |
| Maximum | 100.0% | 94.9% |
| Range | 12.8% | 19.0% |
| Mean | 96.0% | 86.1% |
| Median | 96.3% | 86.3% |
| Interquartile 25% (IQ1) | 94.5% | 82.4% |
| Interquartile 75% (IQ3) | 98.3% | 90.1% |
| Interquartile Range (IQR) | 3.9% | 7.7% |
| Standard Deviation (Sample) | 2.9% | 4.9% |
| Standard Deviation (Population) | 2.9% | 4.8% |
Similar Demographics by 10th Grade
Demographics Similar to Mongolians by 10th Grade
In terms of 10th grade, the demographic groups most similar to Mongolians are Immigrants from Brazil (94.0%, a difference of 0.010%), Immigrants from Kenya (94.0%, a difference of 0.010%), Spanish (94.0%, a difference of 0.010%), Kiowa (93.9%, a difference of 0.010%), and Immigrants from Italy (94.0%, a difference of 0.040%).
| Demographics | Rating | Rank | 10th Grade |
| Ugandans | 80.7 /100 | #149 | Excellent 94.0% |
| Egyptians | 79.6 /100 | #150 | Good 94.0% |
| Kenyans | 79.1 /100 | #151 | Good 94.0% |
| Immigrants | Italy | 78.0 /100 | #152 | Good 94.0% |
| Immigrants | Brazil | 75.5 /100 | #153 | Good 94.0% |
| Immigrants | Kenya | 75.3 /100 | #154 | Good 94.0% |
| Spanish | 74.9 /100 | #155 | Good 94.0% |
| Mongolians | 74.4 /100 | #156 | Good 94.0% |
| Kiowa | 73.3 /100 | #157 | Good 93.9% |
| Bermudans | 71.0 /100 | #158 | Good 93.9% |
| Chileans | 70.2 /100 | #159 | Good 93.9% |
| Pakistanis | 70.1 /100 | #160 | Good 93.9% |
| Assyrians/Chaldeans/Syriacs | 69.7 /100 | #161 | Good 93.9% |
| Immigrants | Poland | 69.6 /100 | #162 | Good 93.9% |
| Venezuelans | 69.5 /100 | #163 | Good 93.9% |
Demographics Similar to Immigrants from Dominican Republic by 10th Grade
In terms of 10th grade, the demographic groups most similar to Immigrants from Dominican Republic are Hispanic or Latino (88.9%, a difference of 0.18%), Immigrants from Honduras (88.5%, a difference of 0.19%), Honduran (89.0%, a difference of 0.30%), Immigrants from the Azores (89.0%, a difference of 0.33%), and Central American (88.4%, a difference of 0.35%).
| Demographics | Rating | Rank | 10th Grade |
| Immigrants | Cabo Verde | 0.0 /100 | #328 | Tragic 89.5% |
| Dominicans | 0.0 /100 | #329 | Tragic 89.4% |
| Immigrants | Yemen | 0.0 /100 | #330 | Tragic 89.1% |
| Mexican American Indians | 0.0 /100 | #331 | Tragic 89.0% |
| Immigrants | Azores | 0.0 /100 | #332 | Tragic 89.0% |
| Hondurans | 0.0 /100 | #333 | Tragic 89.0% |
| Hispanics or Latinos | 0.0 /100 | #334 | Tragic 88.9% |
| Immigrants | Dominican Republic | 0.0 /100 | #335 | Tragic 88.7% |
| Immigrants | Honduras | 0.0 /100 | #336 | Tragic 88.5% |
| Central Americans | 0.0 /100 | #337 | Tragic 88.4% |
| Immigrants | Latin America | 0.0 /100 | #338 | Tragic 88.3% |
| Guatemalans | 0.0 /100 | #339 | Tragic 87.9% |
| Mexicans | 0.0 /100 | #340 | Tragic 87.8% |
| Salvadorans | 0.0 /100 | #341 | Tragic 87.5% |
| Immigrants | Guatemala | 0.0 /100 | #342 | Tragic 87.4% |