Mongolian vs Immigrants from Costa Rica 3rd Grade
COMPARE
Mongolian
Immigrants from Costa Rica
3rd Grade
3rd Grade Comparison
Mongolians
Immigrants from Costa Rica
97.7%
3RD GRADE
29.1/ 100
METRIC RATING
192nd/ 347
METRIC RANK
97.5%
3RD GRADE
2.7/ 100
METRIC RATING
231st/ 347
METRIC RANK
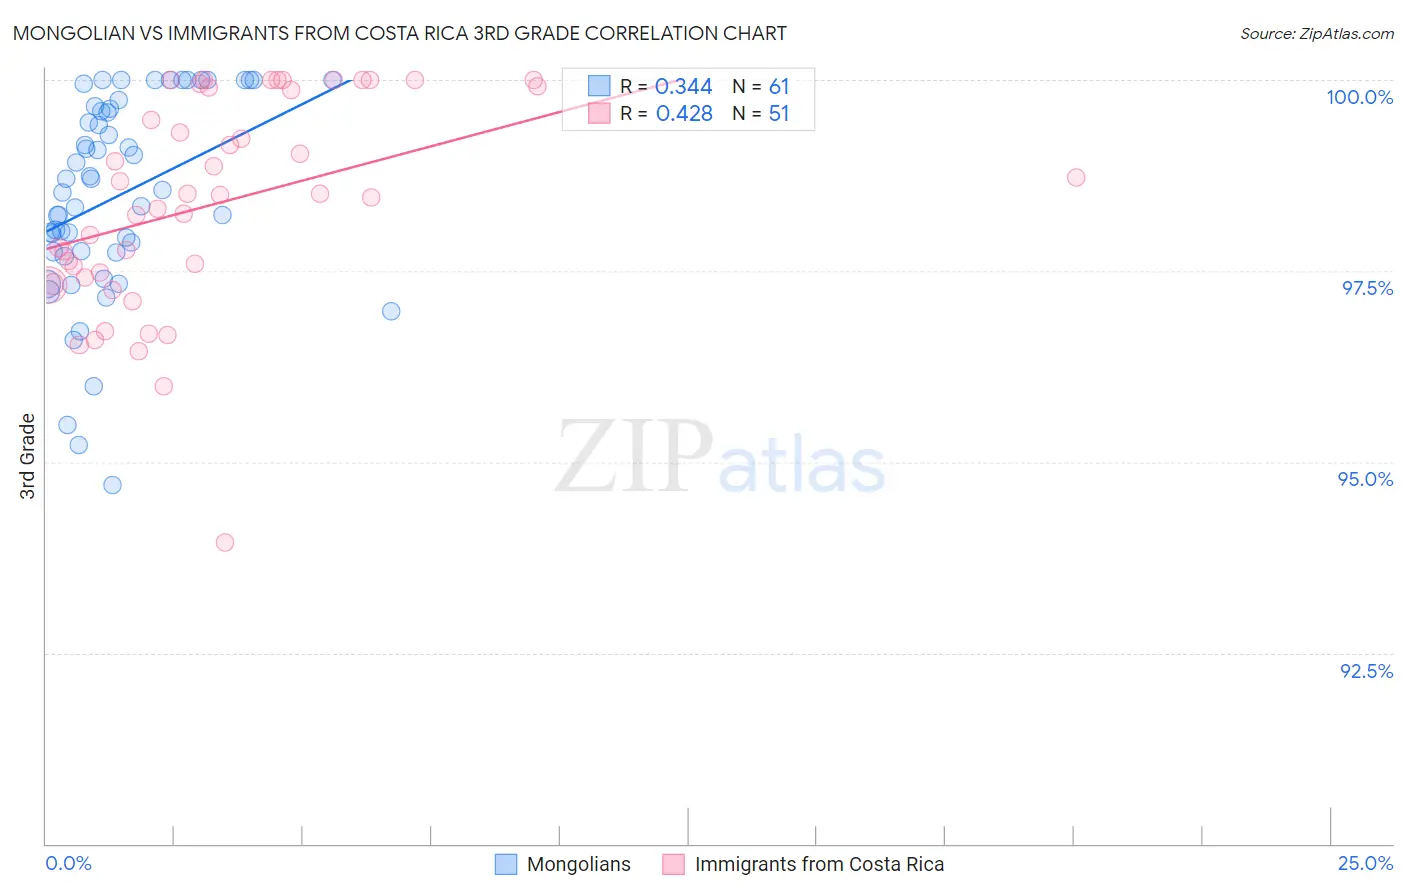
Mongolian vs Immigrants from Costa Rica 3rd Grade Correlation Chart
The statistical analysis conducted on geographies consisting of 140,362,004 people shows a mild positive correlation between the proportion of Mongolians and percentage of population with at least 3rd grade education in the United States with a correlation coefficient (R) of 0.344 and weighted average of 97.7%. Similarly, the statistical analysis conducted on geographies consisting of 204,275,869 people shows a moderate positive correlation between the proportion of Immigrants from Costa Rica and percentage of population with at least 3rd grade education in the United States with a correlation coefficient (R) of 0.428 and weighted average of 97.5%, a difference of 0.23%.
3rd Grade Correlation Summary
| Measurement | Mongolian | Immigrants from Costa Rica |
| Minimum | 94.7% | 93.9% |
| Maximum | 100.0% | 100.0% |
| Range | 5.3% | 6.1% |
| Mean | 98.5% | 98.4% |
| Median | 98.6% | 98.5% |
| Interquartile 25% (IQ1) | 97.7% | 97.4% |
| Interquartile 75% (IQ3) | 99.6% | 99.9% |
| Interquartile Range (IQR) | 1.9% | 2.5% |
| Standard Deviation (Sample) | 1.3% | 1.4% |
| Standard Deviation (Population) | 1.3% | 1.4% |
Similar Demographics by 3rd Grade
Demographics Similar to Mongolians by 3rd Grade
In terms of 3rd grade, the demographic groups most similar to Mongolians are Black/African American (97.7%, a difference of 0.0%), Immigrants from Kenya (97.7%, a difference of 0.0%), Panamanian (97.7%, a difference of 0.010%), Immigrants from Uganda (97.7%, a difference of 0.010%), and Immigrants from Egypt (97.7%, a difference of 0.010%).
| Demographics | Rating | Rank | 3rd Grade |
| Immigrants | Argentina | 37.0 /100 | #185 | Fair 97.7% |
| Portuguese | 36.2 /100 | #186 | Fair 97.7% |
| Natives/Alaskans | 35.2 /100 | #187 | Fair 97.7% |
| Immigrants | Taiwan | 34.2 /100 | #188 | Fair 97.7% |
| Pakistanis | 34.2 /100 | #189 | Fair 97.7% |
| Panamanians | 31.5 /100 | #190 | Fair 97.7% |
| Blacks/African Americans | 29.6 /100 | #191 | Fair 97.7% |
| Mongolians | 29.1 /100 | #192 | Fair 97.7% |
| Immigrants | Kenya | 28.2 /100 | #193 | Fair 97.7% |
| Immigrants | Uganda | 27.4 /100 | #194 | Fair 97.7% |
| Immigrants | Egypt | 26.8 /100 | #195 | Fair 97.7% |
| Paraguayans | 26.2 /100 | #196 | Fair 97.7% |
| Hawaiians | 25.7 /100 | #197 | Fair 97.7% |
| Guamanians/Chamorros | 23.6 /100 | #198 | Fair 97.7% |
| Immigrants | Ukraine | 22.7 /100 | #199 | Fair 97.7% |
Demographics Similar to Immigrants from Costa Rica by 3rd Grade
In terms of 3rd grade, the demographic groups most similar to Immigrants from Costa Rica are Immigrants from Pakistan (97.5%, a difference of 0.0%), Immigrants from Western Asia (97.5%, a difference of 0.0%), Subsaharan African (97.5%, a difference of 0.010%), Senegalese (97.5%, a difference of 0.010%), and Immigrants from Malaysia (97.5%, a difference of 0.010%).
| Demographics | Rating | Rank | 3rd Grade |
| Bahamians | 4.4 /100 | #224 | Tragic 97.5% |
| Tongans | 4.3 /100 | #225 | Tragic 97.5% |
| Sudanese | 4.1 /100 | #226 | Tragic 97.5% |
| Immigrants | Sudan | 3.4 /100 | #227 | Tragic 97.5% |
| Sub-Saharan Africans | 3.2 /100 | #228 | Tragic 97.5% |
| Senegalese | 3.0 /100 | #229 | Tragic 97.5% |
| Immigrants | Pakistan | 2.7 /100 | #230 | Tragic 97.5% |
| Immigrants | Costa Rica | 2.7 /100 | #231 | Tragic 97.5% |
| Immigrants | Western Asia | 2.6 /100 | #232 | Tragic 97.5% |
| Immigrants | Malaysia | 2.4 /100 | #233 | Tragic 97.5% |
| Immigrants | Eastern Asia | 1.9 /100 | #234 | Tragic 97.4% |
| Immigrants | Iraq | 1.8 /100 | #235 | Tragic 97.4% |
| Liberians | 1.8 /100 | #236 | Tragic 97.4% |
| Colombians | 1.8 /100 | #237 | Tragic 97.4% |
| Immigrants | Uruguay | 1.7 /100 | #238 | Tragic 97.4% |