Venezuelan vs Immigrants from Costa Rica 3rd Grade
COMPARE
Venezuelan
Immigrants from Costa Rica
3rd Grade
3rd Grade Comparison
Venezuelans
Immigrants from Costa Rica
97.8%
3RD GRADE
60.9/ 100
METRIC RATING
158th/ 347
METRIC RANK
97.5%
3RD GRADE
2.7/ 100
METRIC RATING
231st/ 347
METRIC RANK
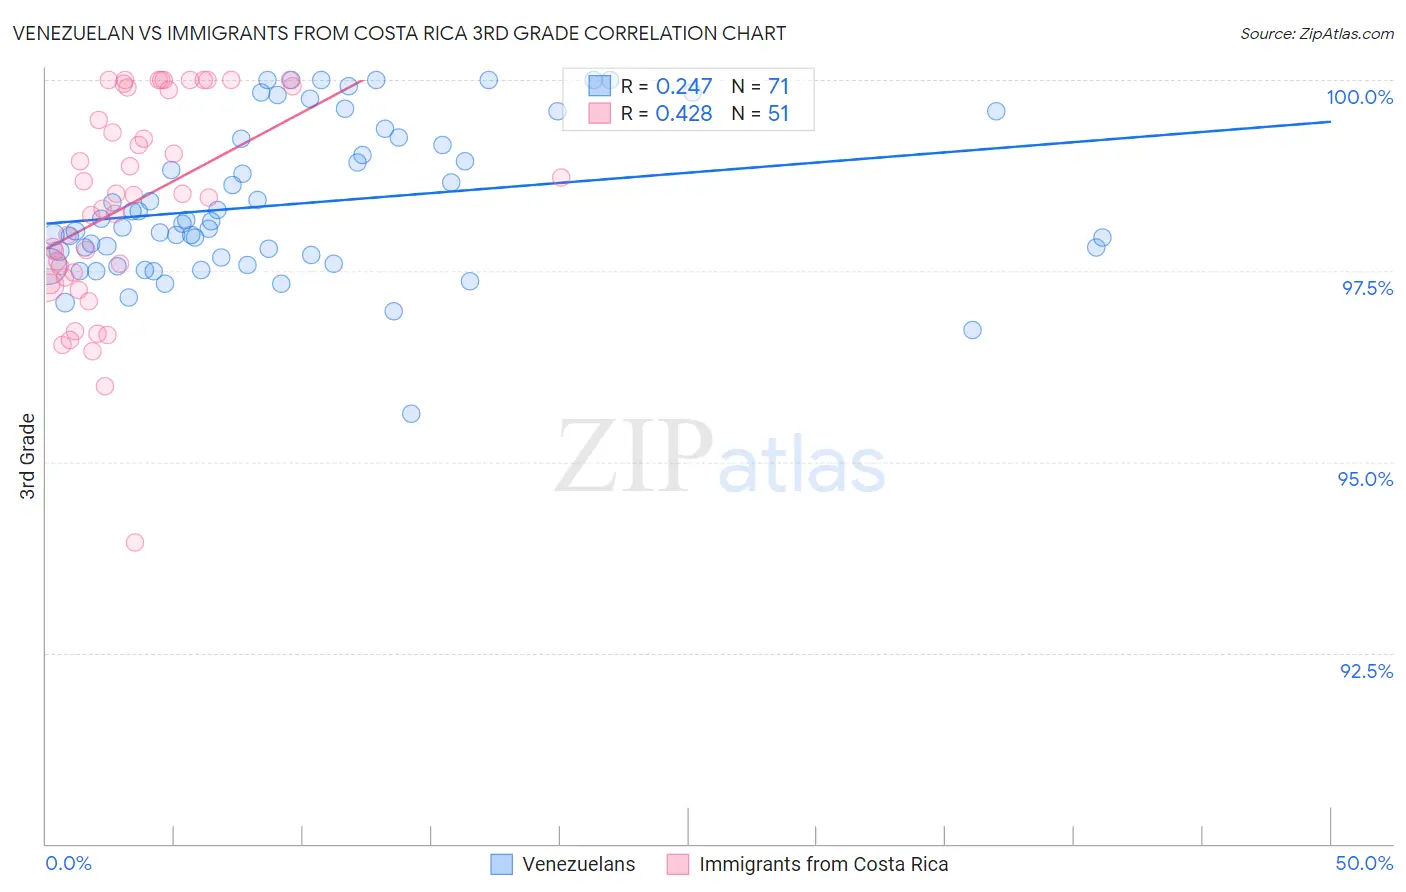
Venezuelan vs Immigrants from Costa Rica 3rd Grade Correlation Chart
The statistical analysis conducted on geographies consisting of 306,323,638 people shows a weak positive correlation between the proportion of Venezuelans and percentage of population with at least 3rd grade education in the United States with a correlation coefficient (R) of 0.247 and weighted average of 97.8%. Similarly, the statistical analysis conducted on geographies consisting of 204,275,869 people shows a moderate positive correlation between the proportion of Immigrants from Costa Rica and percentage of population with at least 3rd grade education in the United States with a correlation coefficient (R) of 0.428 and weighted average of 97.5%, a difference of 0.34%.
3rd Grade Correlation Summary
| Measurement | Venezuelan | Immigrants from Costa Rica |
| Minimum | 95.6% | 93.9% |
| Maximum | 100.0% | 100.0% |
| Range | 4.4% | 6.1% |
| Mean | 98.4% | 98.4% |
| Median | 98.1% | 98.5% |
| Interquartile 25% (IQ1) | 97.7% | 97.4% |
| Interquartile 75% (IQ3) | 99.2% | 99.9% |
| Interquartile Range (IQR) | 1.5% | 2.5% |
| Standard Deviation (Sample) | 0.98% | 1.4% |
| Standard Deviation (Population) | 0.98% | 1.4% |
Similar Demographics by 3rd Grade
Demographics Similar to Venezuelans by 3rd Grade
In terms of 3rd grade, the demographic groups most similar to Venezuelans are Immigrants from Russia (97.8%, a difference of 0.0%), Immigrants from Italy (97.8%, a difference of 0.0%), French American Indian (97.8%, a difference of 0.0%), Immigrants from Eastern Europe (97.8%, a difference of 0.010%), and Bermudan (97.8%, a difference of 0.010%).
| Demographics | Rating | Rank | 3rd Grade |
| Soviet Union | 72.6 /100 | #151 | Good 97.8% |
| Immigrants | South Central Asia | 69.5 /100 | #152 | Good 97.8% |
| Apache | 68.5 /100 | #153 | Good 97.8% |
| Immigrants | Eastern Europe | 64.1 /100 | #154 | Good 97.8% |
| Bermudans | 62.6 /100 | #155 | Good 97.8% |
| Immigrants | Russia | 61.7 /100 | #156 | Good 97.8% |
| Immigrants | Italy | 61.2 /100 | #157 | Good 97.8% |
| Venezuelans | 60.9 /100 | #158 | Good 97.8% |
| French American Indians | 60.0 /100 | #159 | Average 97.8% |
| Immigrants | Iran | 59.1 /100 | #160 | Average 97.8% |
| Albanians | 58.8 /100 | #161 | Average 97.8% |
| Immigrants | Jordan | 57.9 /100 | #162 | Average 97.8% |
| Marshallese | 57.2 /100 | #163 | Average 97.8% |
| Immigrants | Bosnia and Herzegovina | 56.2 /100 | #164 | Average 97.8% |
| Ugandans | 56.1 /100 | #165 | Average 97.8% |
Demographics Similar to Immigrants from Costa Rica by 3rd Grade
In terms of 3rd grade, the demographic groups most similar to Immigrants from Costa Rica are Immigrants from Pakistan (97.5%, a difference of 0.0%), Immigrants from Western Asia (97.5%, a difference of 0.0%), Subsaharan African (97.5%, a difference of 0.010%), Senegalese (97.5%, a difference of 0.010%), and Immigrants from Malaysia (97.5%, a difference of 0.010%).
| Demographics | Rating | Rank | 3rd Grade |
| Bahamians | 4.4 /100 | #224 | Tragic 97.5% |
| Tongans | 4.3 /100 | #225 | Tragic 97.5% |
| Sudanese | 4.1 /100 | #226 | Tragic 97.5% |
| Immigrants | Sudan | 3.4 /100 | #227 | Tragic 97.5% |
| Sub-Saharan Africans | 3.2 /100 | #228 | Tragic 97.5% |
| Senegalese | 3.0 /100 | #229 | Tragic 97.5% |
| Immigrants | Pakistan | 2.7 /100 | #230 | Tragic 97.5% |
| Immigrants | Costa Rica | 2.7 /100 | #231 | Tragic 97.5% |
| Immigrants | Western Asia | 2.6 /100 | #232 | Tragic 97.5% |
| Immigrants | Malaysia | 2.4 /100 | #233 | Tragic 97.5% |
| Immigrants | Eastern Asia | 1.9 /100 | #234 | Tragic 97.4% |
| Immigrants | Iraq | 1.8 /100 | #235 | Tragic 97.4% |
| Liberians | 1.8 /100 | #236 | Tragic 97.4% |
| Colombians | 1.8 /100 | #237 | Tragic 97.4% |
| Immigrants | Uruguay | 1.7 /100 | #238 | Tragic 97.4% |