Mongolian vs Immigrants from Costa Rica 6th Grade
COMPARE
Mongolian
Immigrants from Costa Rica
6th Grade
6th Grade Comparison
Mongolians
Immigrants from Costa Rica
97.0%
6TH GRADE
46.7/ 100
METRIC RATING
177th/ 347
METRIC RANK
96.6%
6TH GRADE
1.3/ 100
METRIC RATING
245th/ 347
METRIC RANK
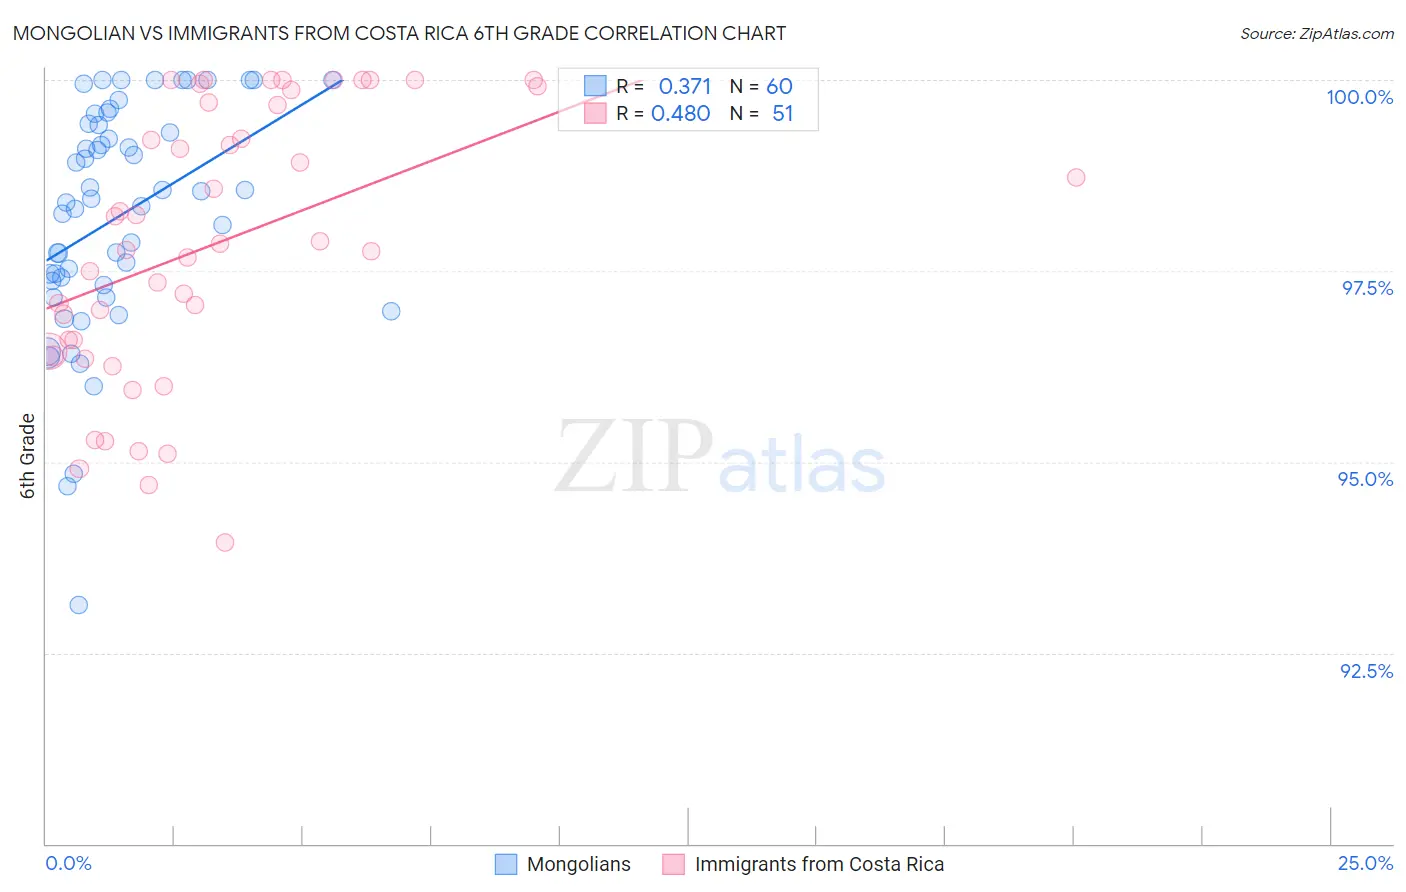
Mongolian vs Immigrants from Costa Rica 6th Grade Correlation Chart
The statistical analysis conducted on geographies consisting of 140,315,038 people shows a mild positive correlation between the proportion of Mongolians and percentage of population with at least 6th grade education in the United States with a correlation coefficient (R) of 0.371 and weighted average of 97.0%. Similarly, the statistical analysis conducted on geographies consisting of 204,275,869 people shows a moderate positive correlation between the proportion of Immigrants from Costa Rica and percentage of population with at least 6th grade education in the United States with a correlation coefficient (R) of 0.480 and weighted average of 96.6%, a difference of 0.48%.
6th Grade Correlation Summary
| Measurement | Mongolian | Immigrants from Costa Rica |
| Minimum | 93.1% | 93.9% |
| Maximum | 100.0% | 100.0% |
| Range | 6.9% | 6.1% |
| Mean | 98.2% | 97.9% |
| Median | 98.4% | 97.9% |
| Interquartile 25% (IQ1) | 97.3% | 96.4% |
| Interquartile 75% (IQ3) | 99.4% | 99.7% |
| Interquartile Range (IQR) | 2.1% | 3.3% |
| Standard Deviation (Sample) | 1.5% | 1.8% |
| Standard Deviation (Population) | 1.5% | 1.7% |
Similar Demographics by 6th Grade
Demographics Similar to Mongolians by 6th Grade
In terms of 6th grade, the demographic groups most similar to Mongolians are Immigrants from Kazakhstan (97.0%, a difference of 0.0%), Immigrants from Micronesia (97.0%, a difference of 0.0%), Pakistani (97.0%, a difference of 0.0%), Venezuelan (97.0%, a difference of 0.010%), and Immigrants from Kenya (97.0%, a difference of 0.010%).
| Demographics | Rating | Rank | 6th Grade |
| Chileans | 52.1 /100 | #170 | Average 97.1% |
| Immigrants | Sri Lanka | 51.7 /100 | #171 | Average 97.1% |
| Egyptians | 50.9 /100 | #172 | Average 97.1% |
| Arabs | 50.1 /100 | #173 | Average 97.0% |
| Venezuelans | 50.0 /100 | #174 | Average 97.0% |
| Immigrants | Kazakhstan | 47.3 /100 | #175 | Average 97.0% |
| Immigrants | Micronesia | 47.1 /100 | #176 | Average 97.0% |
| Mongolians | 46.7 /100 | #177 | Average 97.0% |
| Pakistanis | 46.0 /100 | #178 | Average 97.0% |
| Immigrants | Kenya | 45.3 /100 | #179 | Average 97.0% |
| Immigrants | Spain | 39.9 /100 | #180 | Fair 97.0% |
| Comanche | 37.9 /100 | #181 | Fair 97.0% |
| Immigrants | Ukraine | 35.6 /100 | #182 | Fair 97.0% |
| Immigrants | Venezuela | 34.5 /100 | #183 | Fair 97.0% |
| Spanish Americans | 33.5 /100 | #184 | Fair 97.0% |
Demographics Similar to Immigrants from Costa Rica by 6th Grade
In terms of 6th grade, the demographic groups most similar to Immigrants from Costa Rica are Immigrants from Africa (96.6%, a difference of 0.0%), Ethiopian (96.6%, a difference of 0.020%), Immigrants from Liberia (96.6%, a difference of 0.030%), Bolivian (96.5%, a difference of 0.030%), and Nigerian (96.6%, a difference of 0.040%).
| Demographics | Rating | Rank | 6th Grade |
| Nigerians | 1.9 /100 | #238 | Tragic 96.6% |
| Indians (Asian) | 1.9 /100 | #239 | Tragic 96.6% |
| Koreans | 1.9 /100 | #240 | Tragic 96.6% |
| Senegalese | 1.8 /100 | #241 | Tragic 96.6% |
| Immigrants | Asia | 1.8 /100 | #242 | Tragic 96.6% |
| Immigrants | Liberia | 1.6 /100 | #243 | Tragic 96.6% |
| Ethiopians | 1.5 /100 | #244 | Tragic 96.6% |
| Immigrants | Costa Rica | 1.3 /100 | #245 | Tragic 96.6% |
| Immigrants | Africa | 1.3 /100 | #246 | Tragic 96.6% |
| Bolivians | 1.0 /100 | #247 | Tragic 96.5% |
| Tohono O'odham | 1.0 /100 | #248 | Tragic 96.5% |
| Colombians | 0.9 /100 | #249 | Tragic 96.5% |
| Immigrants | Middle Africa | 0.8 /100 | #250 | Tragic 96.5% |
| Immigrants | Senegal | 0.7 /100 | #251 | Tragic 96.5% |
| Immigrants | Uruguay | 0.6 /100 | #252 | Tragic 96.5% |