Creek vs Immigrants from Costa Rica 3rd Grade
COMPARE
Creek
Immigrants from Costa Rica
3rd Grade
3rd Grade Comparison
Creek
Immigrants from Costa Rica
98.2%
3RD GRADE
99.7/ 100
METRIC RATING
60th/ 347
METRIC RANK
97.5%
3RD GRADE
2.7/ 100
METRIC RATING
231st/ 347
METRIC RANK
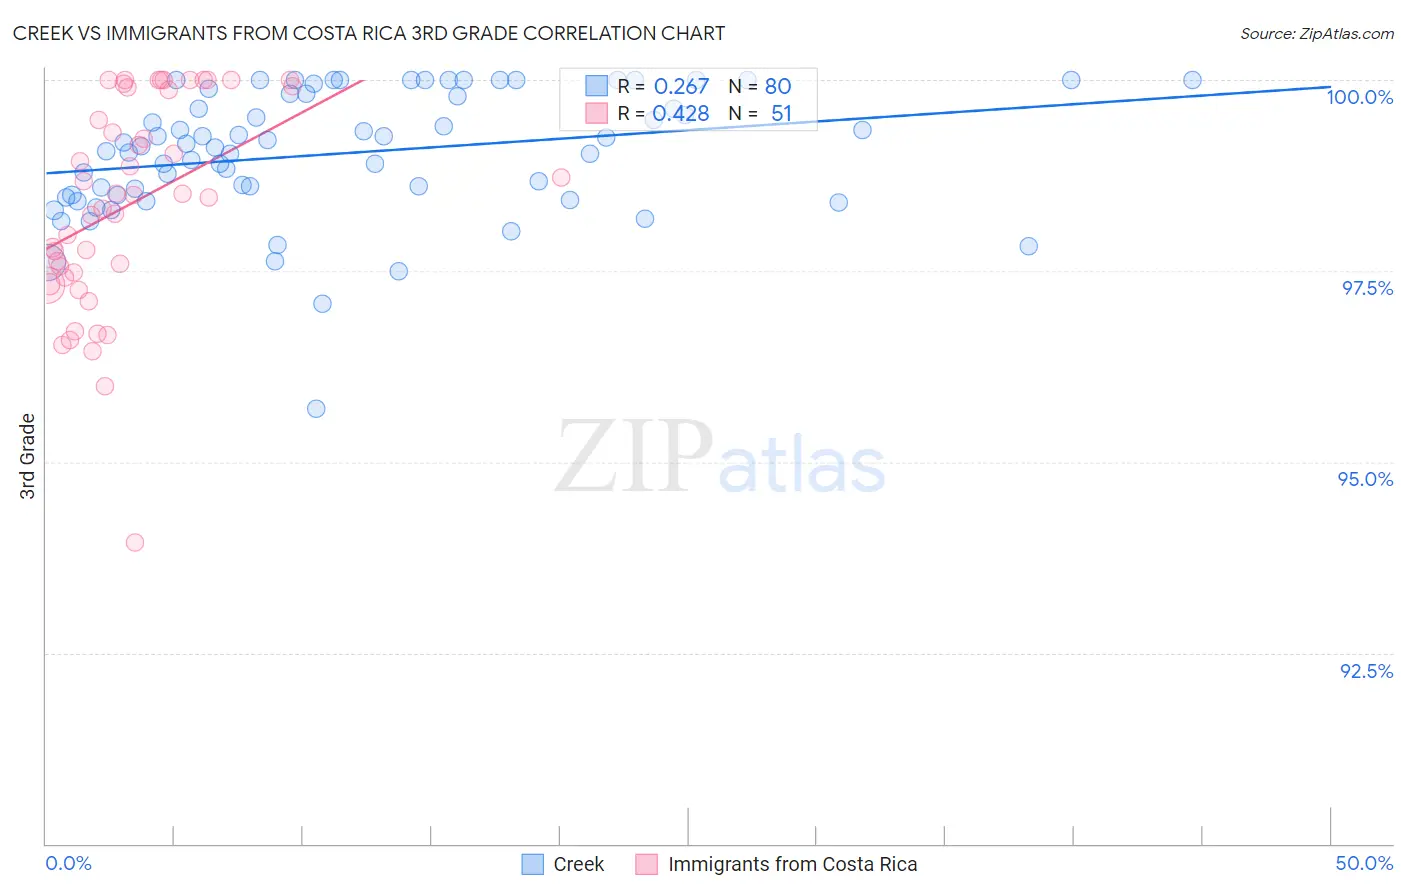
Creek vs Immigrants from Costa Rica 3rd Grade Correlation Chart
The statistical analysis conducted on geographies consisting of 178,480,663 people shows a weak positive correlation between the proportion of Creek and percentage of population with at least 3rd grade education in the United States with a correlation coefficient (R) of 0.267 and weighted average of 98.2%. Similarly, the statistical analysis conducted on geographies consisting of 204,275,869 people shows a moderate positive correlation between the proportion of Immigrants from Costa Rica and percentage of population with at least 3rd grade education in the United States with a correlation coefficient (R) of 0.428 and weighted average of 97.5%, a difference of 0.80%.
3rd Grade Correlation Summary
| Measurement | Creek | Immigrants from Costa Rica |
| Minimum | 95.7% | 93.9% |
| Maximum | 100.0% | 100.0% |
| Range | 4.3% | 6.1% |
| Mean | 99.0% | 98.4% |
| Median | 99.1% | 98.5% |
| Interquartile 25% (IQ1) | 98.5% | 97.4% |
| Interquartile 75% (IQ3) | 99.8% | 99.9% |
| Interquartile Range (IQR) | 1.3% | 2.5% |
| Standard Deviation (Sample) | 0.83% | 1.4% |
| Standard Deviation (Population) | 0.82% | 1.4% |
Similar Demographics by 3rd Grade
Demographics Similar to Creek by 3rd Grade
In terms of 3rd grade, the demographic groups most similar to Creek are Slavic (98.3%, a difference of 0.0%), Greek (98.3%, a difference of 0.0%), Maltese (98.3%, a difference of 0.0%), Bulgarian (98.3%, a difference of 0.010%), and American (98.3%, a difference of 0.010%).
| Demographics | Rating | Rank | 3rd Grade |
| Immigrants | Scotland | 99.8 /100 | #53 | Exceptional 98.3% |
| Bulgarians | 99.8 /100 | #54 | Exceptional 98.3% |
| Americans | 99.8 /100 | #55 | Exceptional 98.3% |
| Austrians | 99.8 /100 | #56 | Exceptional 98.3% |
| Slavs | 99.7 /100 | #57 | Exceptional 98.3% |
| Greeks | 99.7 /100 | #58 | Exceptional 98.3% |
| Maltese | 99.7 /100 | #59 | Exceptional 98.3% |
| Creek | 99.7 /100 | #60 | Exceptional 98.2% |
| Pueblo | 99.7 /100 | #61 | Exceptional 98.2% |
| Immigrants | Canada | 99.7 /100 | #62 | Exceptional 98.2% |
| Immigrants | North America | 99.7 /100 | #63 | Exceptional 98.2% |
| Kiowa | 99.6 /100 | #64 | Exceptional 98.2% |
| New Zealanders | 99.6 /100 | #65 | Exceptional 98.2% |
| Serbians | 99.6 /100 | #66 | Exceptional 98.2% |
| Russians | 99.6 /100 | #67 | Exceptional 98.2% |
Demographics Similar to Immigrants from Costa Rica by 3rd Grade
In terms of 3rd grade, the demographic groups most similar to Immigrants from Costa Rica are Immigrants from Pakistan (97.5%, a difference of 0.0%), Immigrants from Western Asia (97.5%, a difference of 0.0%), Subsaharan African (97.5%, a difference of 0.010%), Senegalese (97.5%, a difference of 0.010%), and Immigrants from Malaysia (97.5%, a difference of 0.010%).
| Demographics | Rating | Rank | 3rd Grade |
| Bahamians | 4.4 /100 | #224 | Tragic 97.5% |
| Tongans | 4.3 /100 | #225 | Tragic 97.5% |
| Sudanese | 4.1 /100 | #226 | Tragic 97.5% |
| Immigrants | Sudan | 3.4 /100 | #227 | Tragic 97.5% |
| Sub-Saharan Africans | 3.2 /100 | #228 | Tragic 97.5% |
| Senegalese | 3.0 /100 | #229 | Tragic 97.5% |
| Immigrants | Pakistan | 2.7 /100 | #230 | Tragic 97.5% |
| Immigrants | Costa Rica | 2.7 /100 | #231 | Tragic 97.5% |
| Immigrants | Western Asia | 2.6 /100 | #232 | Tragic 97.5% |
| Immigrants | Malaysia | 2.4 /100 | #233 | Tragic 97.5% |
| Immigrants | Eastern Asia | 1.9 /100 | #234 | Tragic 97.4% |
| Immigrants | Iraq | 1.8 /100 | #235 | Tragic 97.4% |
| Liberians | 1.8 /100 | #236 | Tragic 97.4% |
| Colombians | 1.8 /100 | #237 | Tragic 97.4% |
| Immigrants | Uruguay | 1.7 /100 | #238 | Tragic 97.4% |