Mongolian vs Immigrants from Philippines 3rd Grade
COMPARE
Mongolian
Immigrants from Philippines
3rd Grade
3rd Grade Comparison
Mongolians
Immigrants from Philippines
97.7%
3RD GRADE
29.1/ 100
METRIC RATING
192nd/ 347
METRIC RANK
97.2%
3RD GRADE
0.1/ 100
METRIC RATING
279th/ 347
METRIC RANK
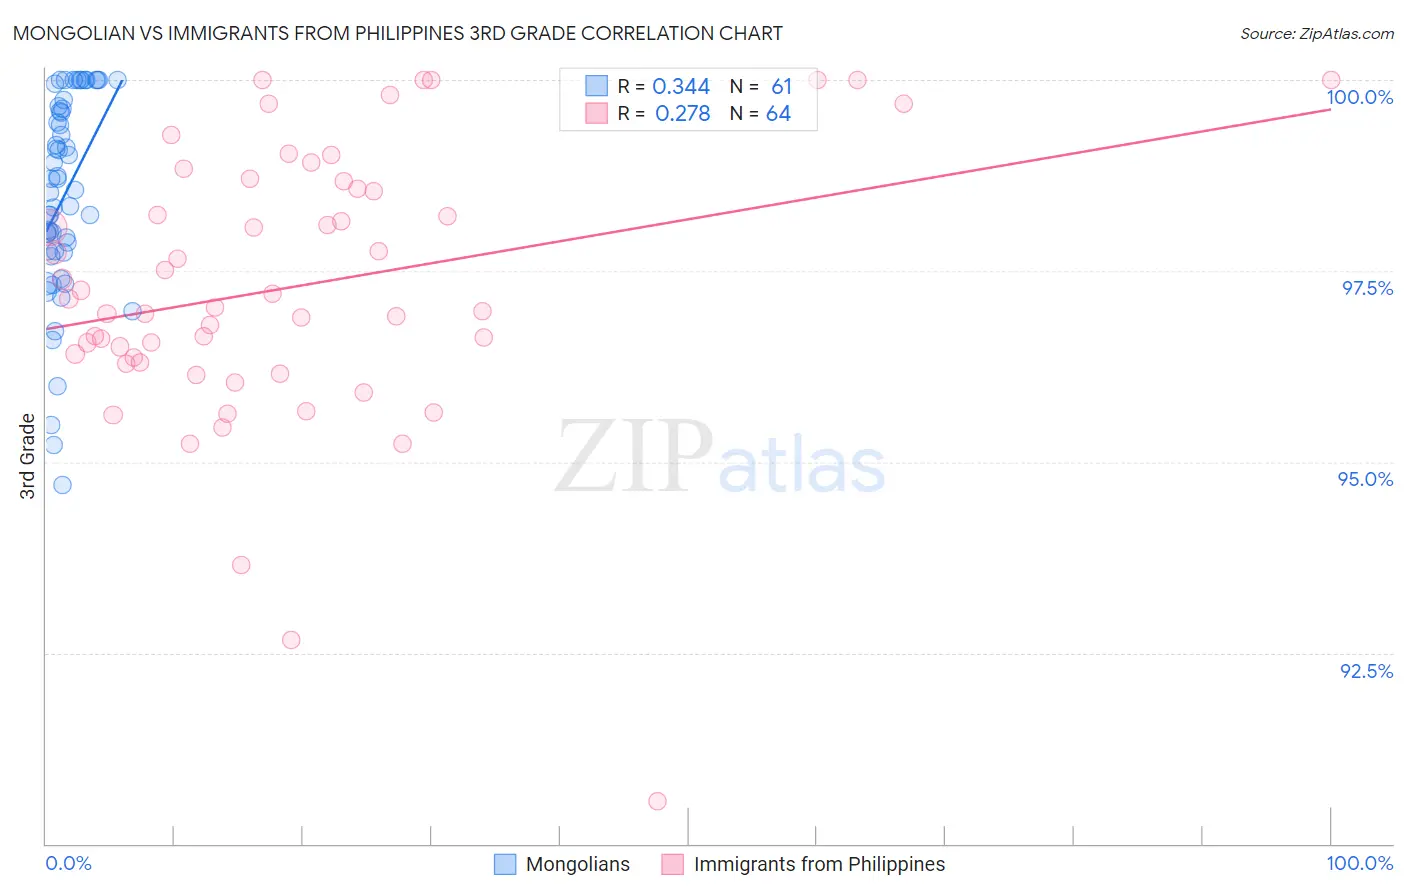
Mongolian vs Immigrants from Philippines 3rd Grade Correlation Chart
The statistical analysis conducted on geographies consisting of 140,362,004 people shows a mild positive correlation between the proportion of Mongolians and percentage of population with at least 3rd grade education in the United States with a correlation coefficient (R) of 0.344 and weighted average of 97.7%. Similarly, the statistical analysis conducted on geographies consisting of 471,303,531 people shows a weak positive correlation between the proportion of Immigrants from Philippines and percentage of population with at least 3rd grade education in the United States with a correlation coefficient (R) of 0.278 and weighted average of 97.2%, a difference of 0.54%.
3rd Grade Correlation Summary
| Measurement | Mongolian | Immigrants from Philippines |
| Minimum | 94.7% | 90.6% |
| Maximum | 100.0% | 100.0% |
| Range | 5.3% | 9.4% |
| Mean | 98.5% | 97.3% |
| Median | 98.6% | 97.1% |
| Interquartile 25% (IQ1) | 97.7% | 96.3% |
| Interquartile 75% (IQ3) | 99.6% | 98.6% |
| Interquartile Range (IQR) | 1.9% | 2.3% |
| Standard Deviation (Sample) | 1.3% | 1.8% |
| Standard Deviation (Population) | 1.3% | 1.8% |
Similar Demographics by 3rd Grade
Demographics Similar to Mongolians by 3rd Grade
In terms of 3rd grade, the demographic groups most similar to Mongolians are Black/African American (97.7%, a difference of 0.0%), Immigrants from Kenya (97.7%, a difference of 0.0%), Panamanian (97.7%, a difference of 0.010%), Immigrants from Uganda (97.7%, a difference of 0.010%), and Immigrants from Egypt (97.7%, a difference of 0.010%).
| Demographics | Rating | Rank | 3rd Grade |
| Immigrants | Argentina | 37.0 /100 | #185 | Fair 97.7% |
| Portuguese | 36.2 /100 | #186 | Fair 97.7% |
| Natives/Alaskans | 35.2 /100 | #187 | Fair 97.7% |
| Immigrants | Taiwan | 34.2 /100 | #188 | Fair 97.7% |
| Pakistanis | 34.2 /100 | #189 | Fair 97.7% |
| Panamanians | 31.5 /100 | #190 | Fair 97.7% |
| Blacks/African Americans | 29.6 /100 | #191 | Fair 97.7% |
| Mongolians | 29.1 /100 | #192 | Fair 97.7% |
| Immigrants | Kenya | 28.2 /100 | #193 | Fair 97.7% |
| Immigrants | Uganda | 27.4 /100 | #194 | Fair 97.7% |
| Immigrants | Egypt | 26.8 /100 | #195 | Fair 97.7% |
| Paraguayans | 26.2 /100 | #196 | Fair 97.7% |
| Hawaiians | 25.7 /100 | #197 | Fair 97.7% |
| Guamanians/Chamorros | 23.6 /100 | #198 | Fair 97.7% |
| Immigrants | Ukraine | 22.7 /100 | #199 | Fair 97.7% |
Demographics Similar to Immigrants from Philippines by 3rd Grade
In terms of 3rd grade, the demographic groups most similar to Immigrants from Philippines are Immigrants from Ghana (97.2%, a difference of 0.0%), Immigrants from Bolivia (97.2%, a difference of 0.010%), Trinidadian and Tobagonian (97.2%, a difference of 0.010%), Immigrants from Western Africa (97.2%, a difference of 0.010%), and Barbadian (97.2%, a difference of 0.010%).
| Demographics | Rating | Rank | 3rd Grade |
| Ghanaians | 0.1 /100 | #272 | Tragic 97.2% |
| Immigrants | Peru | 0.1 /100 | #273 | Tragic 97.2% |
| Immigrants | Cameroon | 0.1 /100 | #274 | Tragic 97.2% |
| Immigrants | Uzbekistan | 0.1 /100 | #275 | Tragic 97.2% |
| Immigrants | Bolivia | 0.1 /100 | #276 | Tragic 97.2% |
| Trinidadians and Tobagonians | 0.1 /100 | #277 | Tragic 97.2% |
| Immigrants | Western Africa | 0.1 /100 | #278 | Tragic 97.2% |
| Immigrants | Philippines | 0.1 /100 | #279 | Tragic 97.2% |
| Immigrants | Ghana | 0.1 /100 | #280 | Tragic 97.2% |
| Barbadians | 0.1 /100 | #281 | Tragic 97.2% |
| Afghans | 0.1 /100 | #282 | Tragic 97.1% |
| Houma | 0.1 /100 | #283 | Tragic 97.1% |
| Immigrants | Trinidad and Tobago | 0.0 /100 | #284 | Tragic 97.1% |
| Immigrants | Hong Kong | 0.0 /100 | #285 | Tragic 97.1% |
| Immigrants | Barbados | 0.0 /100 | #286 | Tragic 97.1% |