Mongolian vs Immigrants from Middle Africa 9th Grade
COMPARE
Mongolian
Immigrants from Middle Africa
9th Grade
9th Grade Comparison
Mongolians
Immigrants from Middle Africa
95.0%
9TH GRADE
73.0/ 100
METRIC RATING
157th/ 347
METRIC RANK
94.2%
9TH GRADE
2.2/ 100
METRIC RATING
242nd/ 347
METRIC RANK
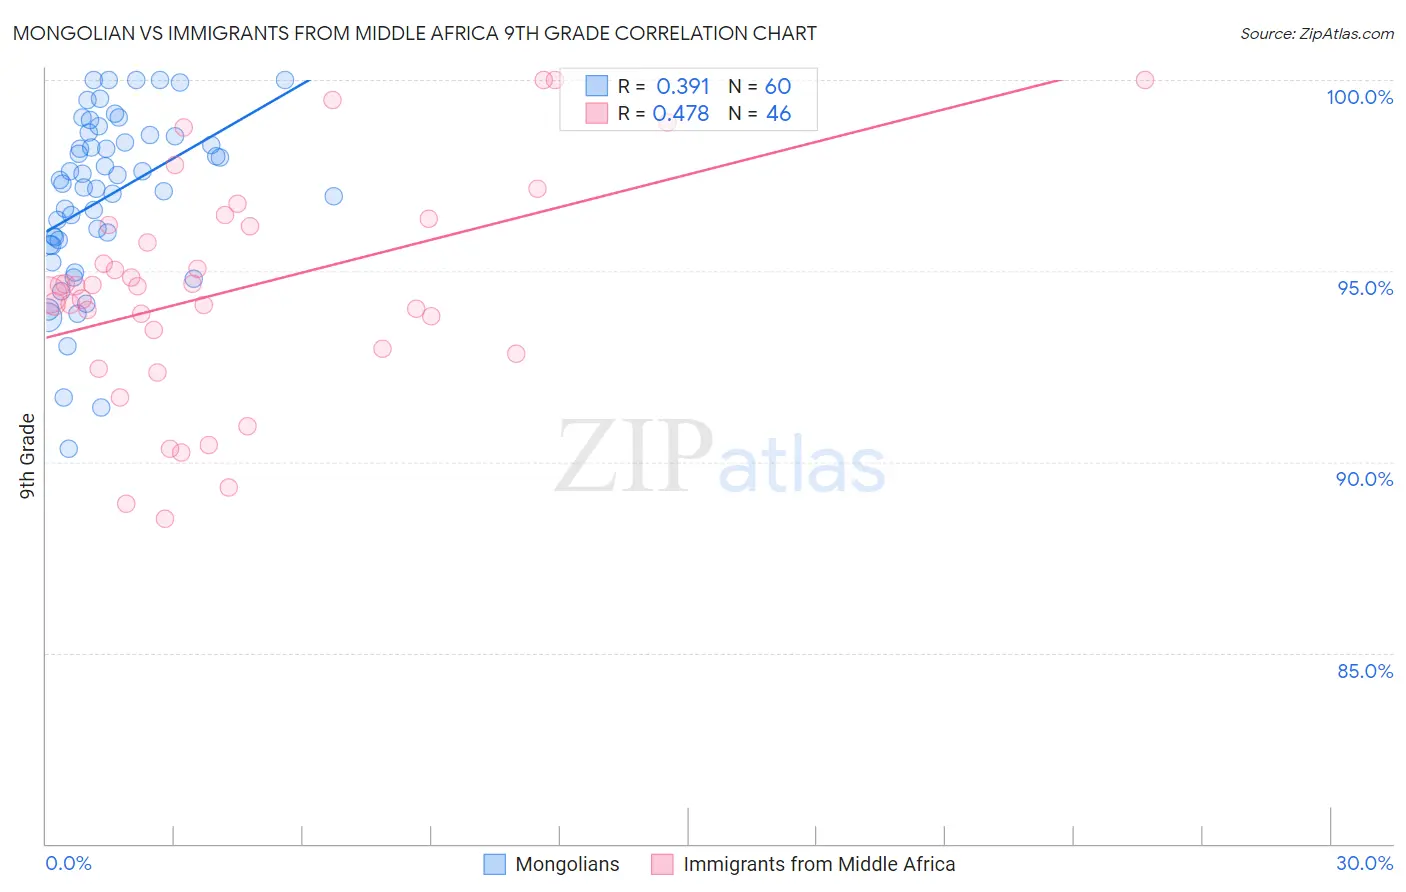
Mongolian vs Immigrants from Middle Africa 9th Grade Correlation Chart
The statistical analysis conducted on geographies consisting of 140,247,278 people shows a mild positive correlation between the proportion of Mongolians and percentage of population with at least 9th grade education in the United States with a correlation coefficient (R) of 0.391 and weighted average of 95.0%. Similarly, the statistical analysis conducted on geographies consisting of 202,699,867 people shows a moderate positive correlation between the proportion of Immigrants from Middle Africa and percentage of population with at least 9th grade education in the United States with a correlation coefficient (R) of 0.478 and weighted average of 94.2%, a difference of 0.89%.
9th Grade Correlation Summary
| Measurement | Mongolian | Immigrants from Middle Africa |
| Minimum | 90.4% | 88.5% |
| Maximum | 100.0% | 100.0% |
| Range | 9.6% | 11.5% |
| Mean | 96.9% | 94.5% |
| Median | 97.3% | 94.6% |
| Interquartile 25% (IQ1) | 95.7% | 93.0% |
| Interquartile 75% (IQ3) | 98.6% | 96.2% |
| Interquartile Range (IQR) | 2.8% | 3.2% |
| Standard Deviation (Sample) | 2.2% | 2.9% |
| Standard Deviation (Population) | 2.2% | 2.9% |
Similar Demographics by 9th Grade
Demographics Similar to Mongolians by 9th Grade
In terms of 9th grade, the demographic groups most similar to Mongolians are Immigrants from Kenya (95.0%, a difference of 0.0%), Arab (95.1%, a difference of 0.020%), Immigrants from Kazakhstan (95.1%, a difference of 0.020%), Albanian (95.1%, a difference of 0.030%), and Egyptian (95.0%, a difference of 0.030%).
| Demographics | Rating | Rank | 9th Grade |
| Kenyans | 79.1 /100 | #150 | Good 95.1% |
| Cajuns | 77.3 /100 | #151 | Good 95.1% |
| Ugandans | 77.0 /100 | #152 | Good 95.1% |
| Albanians | 76.1 /100 | #153 | Good 95.1% |
| Arabs | 74.9 /100 | #154 | Good 95.1% |
| Immigrants | Kazakhstan | 74.7 /100 | #155 | Good 95.1% |
| Immigrants | Kenya | 73.1 /100 | #156 | Good 95.0% |
| Mongolians | 73.0 /100 | #157 | Good 95.0% |
| Egyptians | 70.1 /100 | #158 | Good 95.0% |
| Immigrants | Ukraine | 67.4 /100 | #159 | Good 95.0% |
| Immigrants | Italy | 66.6 /100 | #160 | Good 95.0% |
| French American Indians | 66.5 /100 | #161 | Good 95.0% |
| Bermudans | 65.8 /100 | #162 | Good 95.0% |
| Pakistanis | 64.1 /100 | #163 | Good 95.0% |
| Venezuelans | 63.6 /100 | #164 | Good 95.0% |
Demographics Similar to Immigrants from Middle Africa by 9th Grade
In terms of 9th grade, the demographic groups most similar to Immigrants from Middle Africa are Immigrants from Cameroon (94.2%, a difference of 0.0%), Dutch West Indian (94.2%, a difference of 0.010%), Paiute (94.2%, a difference of 0.020%), Senegalese (94.2%, a difference of 0.020%), and Afghan (94.2%, a difference of 0.030%).
| Demographics | Rating | Rank | 9th Grade |
| Bolivians | 3.3 /100 | #235 | Tragic 94.3% |
| Somalis | 2.9 /100 | #236 | Tragic 94.3% |
| Koreans | 2.9 /100 | #237 | Tragic 94.3% |
| South American Indians | 2.8 /100 | #238 | Tragic 94.3% |
| Immigrants | China | 2.8 /100 | #239 | Tragic 94.3% |
| Immigrants | Ethiopia | 2.7 /100 | #240 | Tragic 94.3% |
| Spanish Americans | 2.6 /100 | #241 | Tragic 94.2% |
| Immigrants | Middle Africa | 2.2 /100 | #242 | Tragic 94.2% |
| Immigrants | Cameroon | 2.1 /100 | #243 | Tragic 94.2% |
| Dutch West Indians | 2.0 /100 | #244 | Tragic 94.2% |
| Paiute | 1.9 /100 | #245 | Tragic 94.2% |
| Senegalese | 1.9 /100 | #246 | Tragic 94.2% |
| Afghans | 1.8 /100 | #247 | Tragic 94.2% |
| Immigrants | Somalia | 1.4 /100 | #248 | Tragic 94.1% |
| Uruguayans | 1.3 /100 | #249 | Tragic 94.1% |