Mongolian vs Immigrants from Ireland 9th Grade
COMPARE
Mongolian
Immigrants from Ireland
9th Grade
9th Grade Comparison
Mongolians
Immigrants from Ireland
95.0%
9TH GRADE
73.0/ 100
METRIC RATING
157th/ 347
METRIC RANK
95.8%
9TH GRADE
99.6/ 100
METRIC RATING
68th/ 347
METRIC RANK
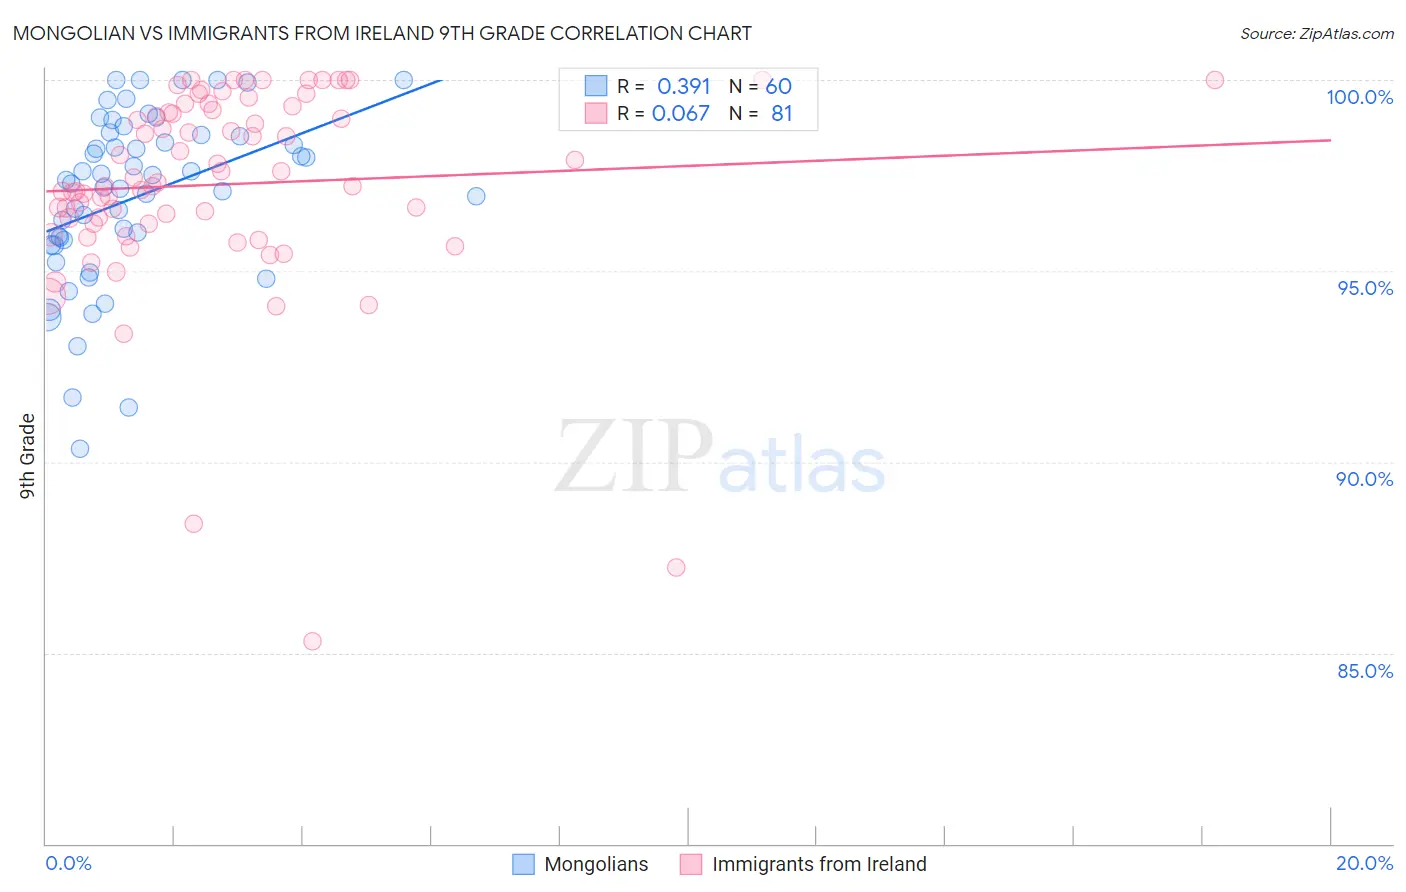
Mongolian vs Immigrants from Ireland 9th Grade Correlation Chart
The statistical analysis conducted on geographies consisting of 140,247,278 people shows a mild positive correlation between the proportion of Mongolians and percentage of population with at least 9th grade education in the United States with a correlation coefficient (R) of 0.391 and weighted average of 95.0%. Similarly, the statistical analysis conducted on geographies consisting of 240,784,498 people shows a slight positive correlation between the proportion of Immigrants from Ireland and percentage of population with at least 9th grade education in the United States with a correlation coefficient (R) of 0.067 and weighted average of 95.8%, a difference of 0.82%.
9th Grade Correlation Summary
| Measurement | Mongolian | Immigrants from Ireland |
| Minimum | 90.4% | 85.3% |
| Maximum | 100.0% | 100.0% |
| Range | 9.6% | 14.7% |
| Mean | 96.9% | 97.3% |
| Median | 97.3% | 97.3% |
| Interquartile 25% (IQ1) | 95.7% | 96.2% |
| Interquartile 75% (IQ3) | 98.6% | 99.3% |
| Interquartile Range (IQR) | 2.8% | 3.0% |
| Standard Deviation (Sample) | 2.2% | 2.7% |
| Standard Deviation (Population) | 2.2% | 2.7% |
Similar Demographics by 9th Grade
Demographics Similar to Mongolians by 9th Grade
In terms of 9th grade, the demographic groups most similar to Mongolians are Immigrants from Kenya (95.0%, a difference of 0.0%), Arab (95.1%, a difference of 0.020%), Immigrants from Kazakhstan (95.1%, a difference of 0.020%), Albanian (95.1%, a difference of 0.030%), and Egyptian (95.0%, a difference of 0.030%).
| Demographics | Rating | Rank | 9th Grade |
| Kenyans | 79.1 /100 | #150 | Good 95.1% |
| Cajuns | 77.3 /100 | #151 | Good 95.1% |
| Ugandans | 77.0 /100 | #152 | Good 95.1% |
| Albanians | 76.1 /100 | #153 | Good 95.1% |
| Arabs | 74.9 /100 | #154 | Good 95.1% |
| Immigrants | Kazakhstan | 74.7 /100 | #155 | Good 95.1% |
| Immigrants | Kenya | 73.1 /100 | #156 | Good 95.0% |
| Mongolians | 73.0 /100 | #157 | Good 95.0% |
| Egyptians | 70.1 /100 | #158 | Good 95.0% |
| Immigrants | Ukraine | 67.4 /100 | #159 | Good 95.0% |
| Immigrants | Italy | 66.6 /100 | #160 | Good 95.0% |
| French American Indians | 66.5 /100 | #161 | Good 95.0% |
| Bermudans | 65.8 /100 | #162 | Good 95.0% |
| Pakistanis | 64.1 /100 | #163 | Good 95.0% |
| Venezuelans | 63.6 /100 | #164 | Good 95.0% |
Demographics Similar to Immigrants from Ireland by 9th Grade
In terms of 9th grade, the demographic groups most similar to Immigrants from Ireland are Cypriot (95.8%, a difference of 0.0%), Immigrants from Lithuania (95.8%, a difference of 0.0%), Immigrants from Netherlands (95.8%, a difference of 0.010%), Immigrants from Australia (95.8%, a difference of 0.020%), and Immigrants from Belgium (95.8%, a difference of 0.020%).
| Demographics | Rating | Rank | 9th Grade |
| Sioux | 99.8 /100 | #61 | Exceptional 95.9% |
| Ukrainians | 99.7 /100 | #62 | Exceptional 95.9% |
| Canadians | 99.7 /100 | #63 | Exceptional 95.9% |
| Zimbabweans | 99.7 /100 | #64 | Exceptional 95.9% |
| Immigrants | England | 99.6 /100 | #65 | Exceptional 95.9% |
| Immigrants | Netherlands | 99.6 /100 | #66 | Exceptional 95.8% |
| Cypriots | 99.6 /100 | #67 | Exceptional 95.8% |
| Immigrants | Ireland | 99.6 /100 | #68 | Exceptional 95.8% |
| Immigrants | Lithuania | 99.6 /100 | #69 | Exceptional 95.8% |
| Immigrants | Australia | 99.5 /100 | #70 | Exceptional 95.8% |
| Immigrants | Belgium | 99.5 /100 | #71 | Exceptional 95.8% |
| Turks | 99.5 /100 | #72 | Exceptional 95.8% |
| Immigrants | Singapore | 99.5 /100 | #73 | Exceptional 95.8% |
| Thais | 99.5 /100 | #74 | Exceptional 95.8% |
| Inupiat | 99.5 /100 | #75 | Exceptional 95.8% |